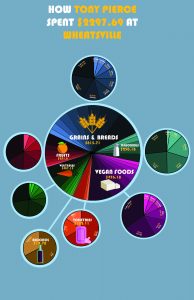
The assignment for this portion was to create a map based on data pulled from a lengthy spreadsheet. The data in this spread sheet consisted of receipts from a grocery store. Early on for this map I made the decision to be as in-depth as possible on this map. In order to accomplish this I broke down each individual item into a series of broader categories, and calculated the exact amount of money spent on each item and each category I arranged each category as a separate pie chart to act as a sort of magnifying glass to its corresponding section on the total pie chart. The data in the spreadsheet was very detailed and exact. However the food was entirely vegetarian. I interpreted this to mean that the customer was someone well organized but also maybe somewhat eccentric. That is why I designed a thorough a colorful map. As a side note due to a file management mishap, I only have this 85% complete version left to show.