On June 28th Qualtrics’ interface will be updated to the new Insight Platform featuring a new layout and design. You can try out the new interface immediately by clicking on “Experience the Qualtrics Insight Platform” or wait until it goes live on the 28th. While it looks different, most of the changes are cosmetic and you will still access your surveys under the new landing page. The new user interface organizes surveys into “My Projects”, surveys you created, and “Shared with Me”, surveys shared with you. Qualtrics also added a few new features. We will focus on the interface changes and basic use in this post.
What are the Changes?
The new landing page interface:
1.) My Surveys: The new My Projects landing page replaced the My Surveys page. You will see Projects, Contacts, and Libraries on the top navigation, which will be visible for you on every screen.
2.) Moved survey tasks to the Project Options dropdown. 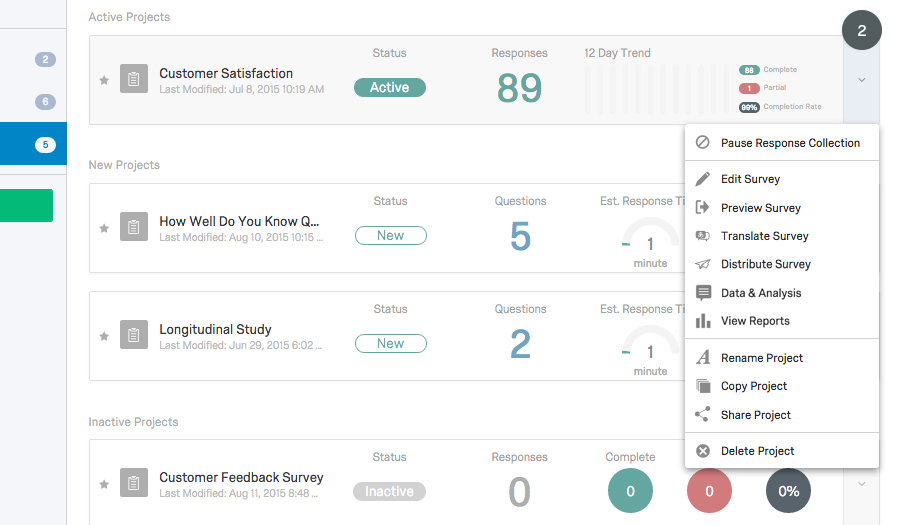
3.) Folder Panel: Shifted folder layout and options to the Folder Pane on the left of the landing page. 
4.) Create Project button: Replaced the Create Survey tab with the Create Project button instead of the old navigation tab on the top. 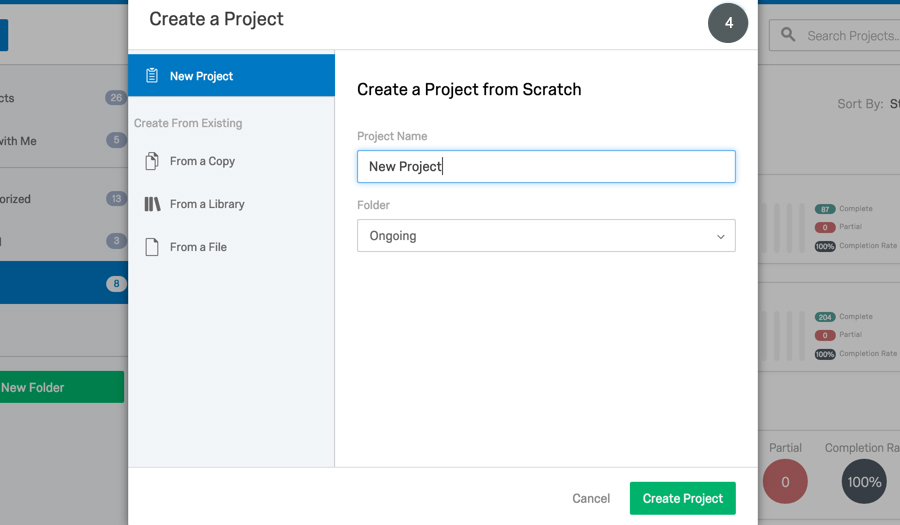
Check out the Summary video tutorial below for a quick review.
Edit Your Survey:
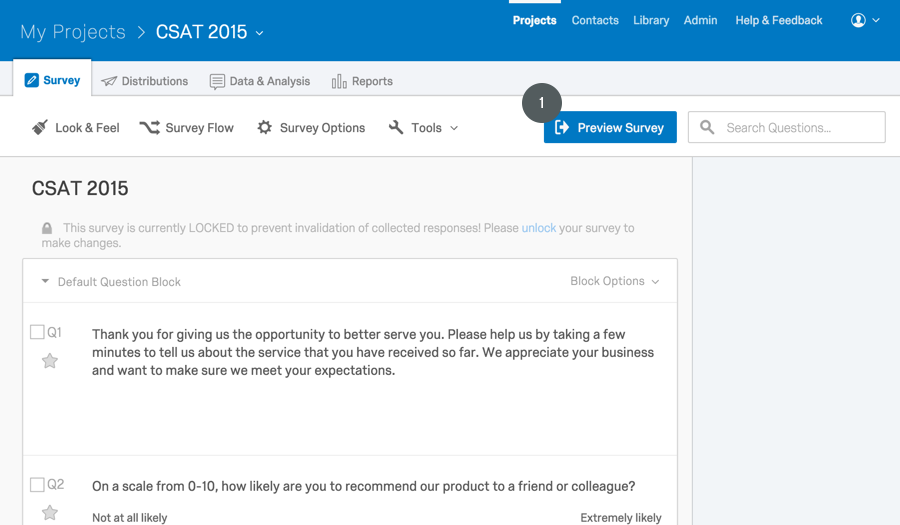
1.) Preview Survey: You can preview your survey by clicking the “Preview Survey” to the far right.
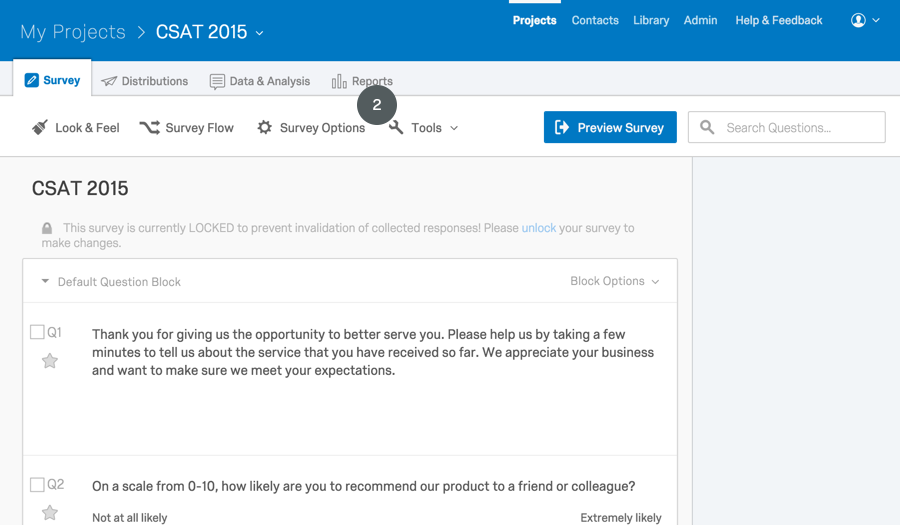
2.) Tools: Advanced Options now is a dropdown menu labeled as “Tools”. The “Print Survey” tool is also under this menu.
Check out the “How to edit the survey” tutorial below:
Distribute Your Survey:
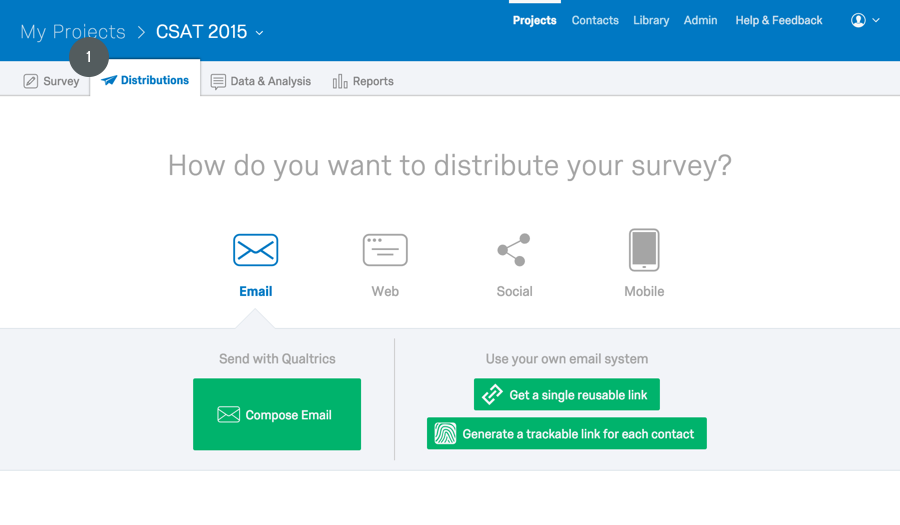
The Distribute Survey tab is now located on the top navigation tab. The first time you enter this module for a new survey, you’ll be prompted to choose your distribution channel (email, web, etc.).
1.) Choose your distribution channel.
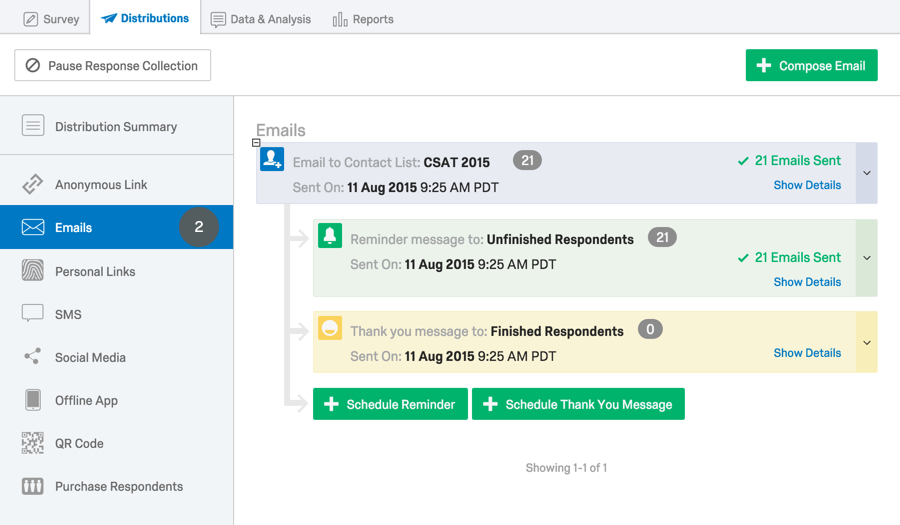
2.) Emails Tab: You will see both Email Survey and Email History in the Emails Tab on the left navigation panel.
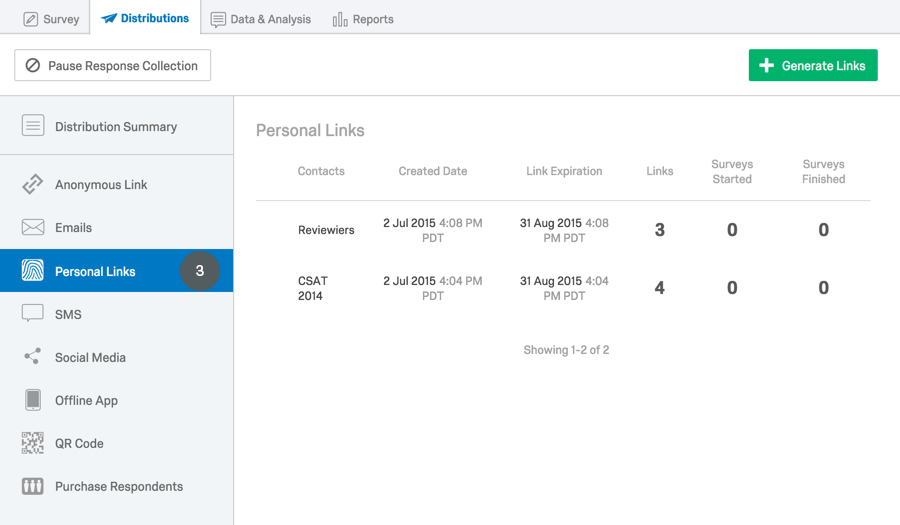
3.) Personal Links: Personal Links on the left side panel allows you to generate links.
Check out the “Distribute a Survey” tutorial below:
View the Survey Results:
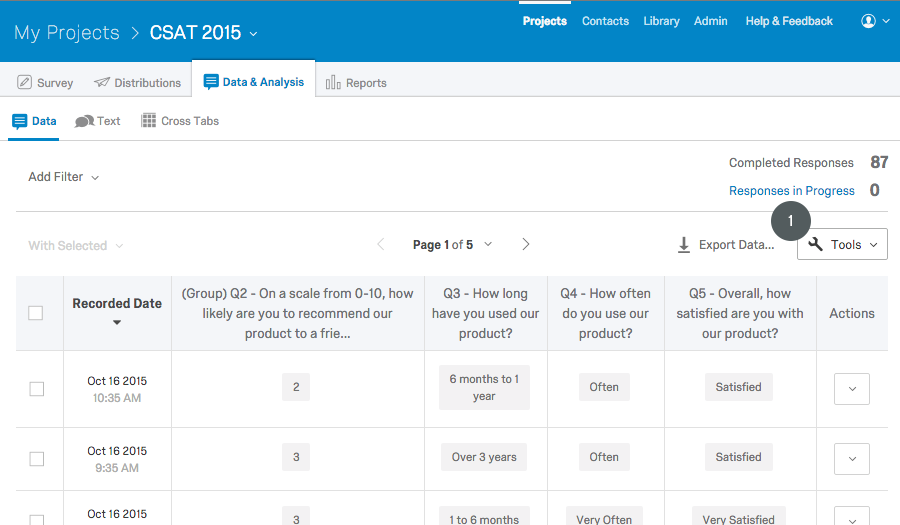
The Data & Analysis and Reports modules on the top replaces the View Results tab. Under the Data & Analysis module you can view, manage, analyze, and export individual response entries. From Reports, you can visualize, explore, and report on your aggregate data.
1.) Tools: Tools dropdown includes the Advanced Options, such as Export and Import Data
2.) Export Responses: You will choose which data file you want the data to export.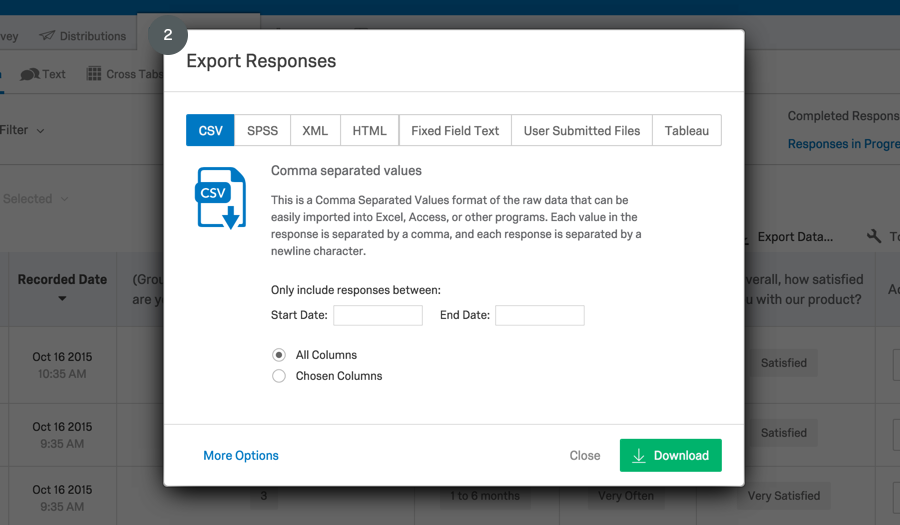
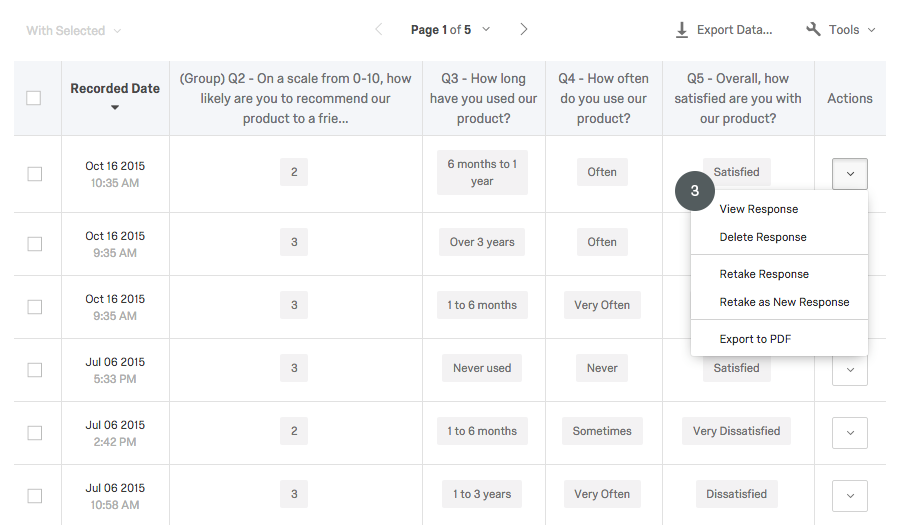
3.) Action Dropdown Menu: All response-related actions (viewing, exporting to PDF, etc.) have moved to the Actions dropdown menu in Data & Analysis.
For more information about the new Qualtrics interface, check out the Qualtrics website or contact Instructional Technology for further consultation.

