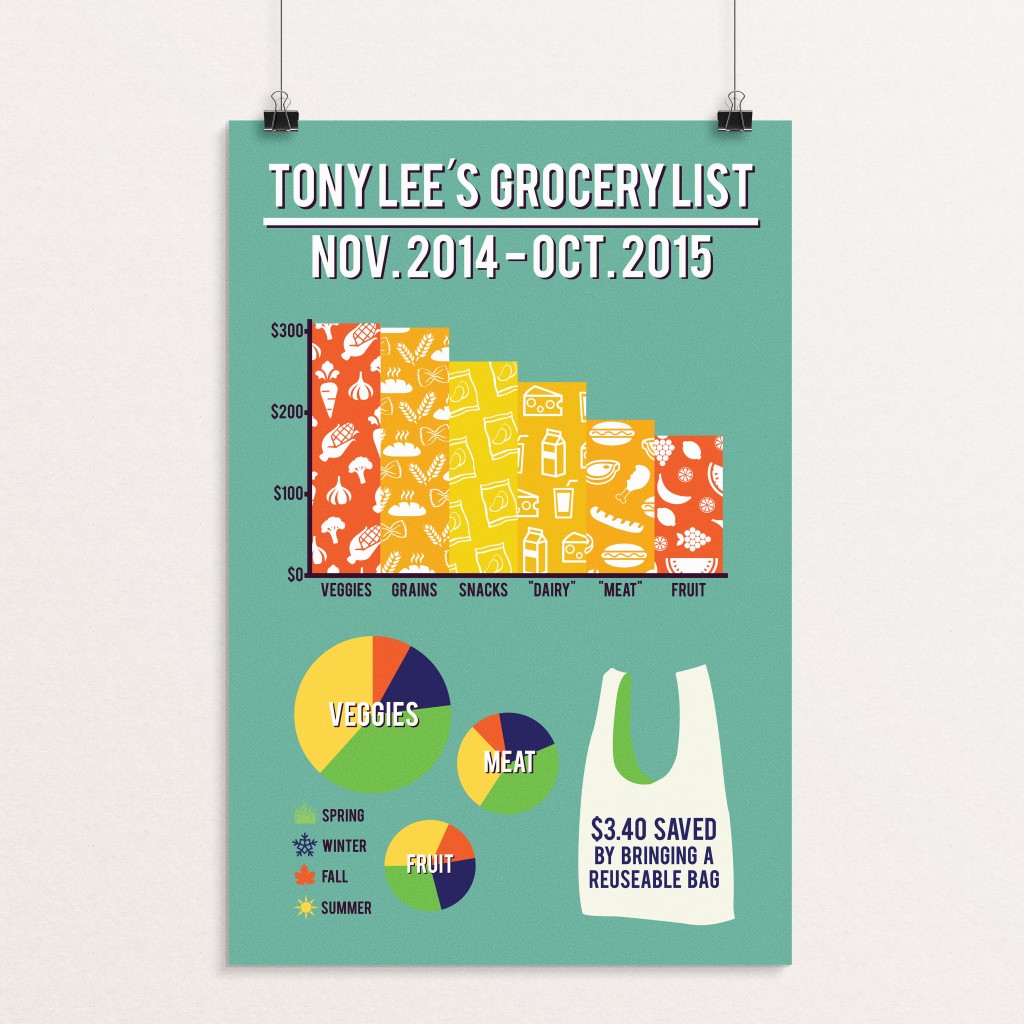
 For this assignment we were given an excel spreadsheet of every grocery store transaction that “Tony Lee” made in 12 months. We were allowed to present whatever findings we had from the information. Based on the purchases made by this person I assumed that this person was following a vegan diet. Because of this I decided to display how much money was spent on different food groups in an entire year. I also displayed how much money was spent in these food groups per season. Lastly I displayed how much money was saved by bringing reusable bags to the grocery store. This project taught me a lot about sorting data and organizing information.