
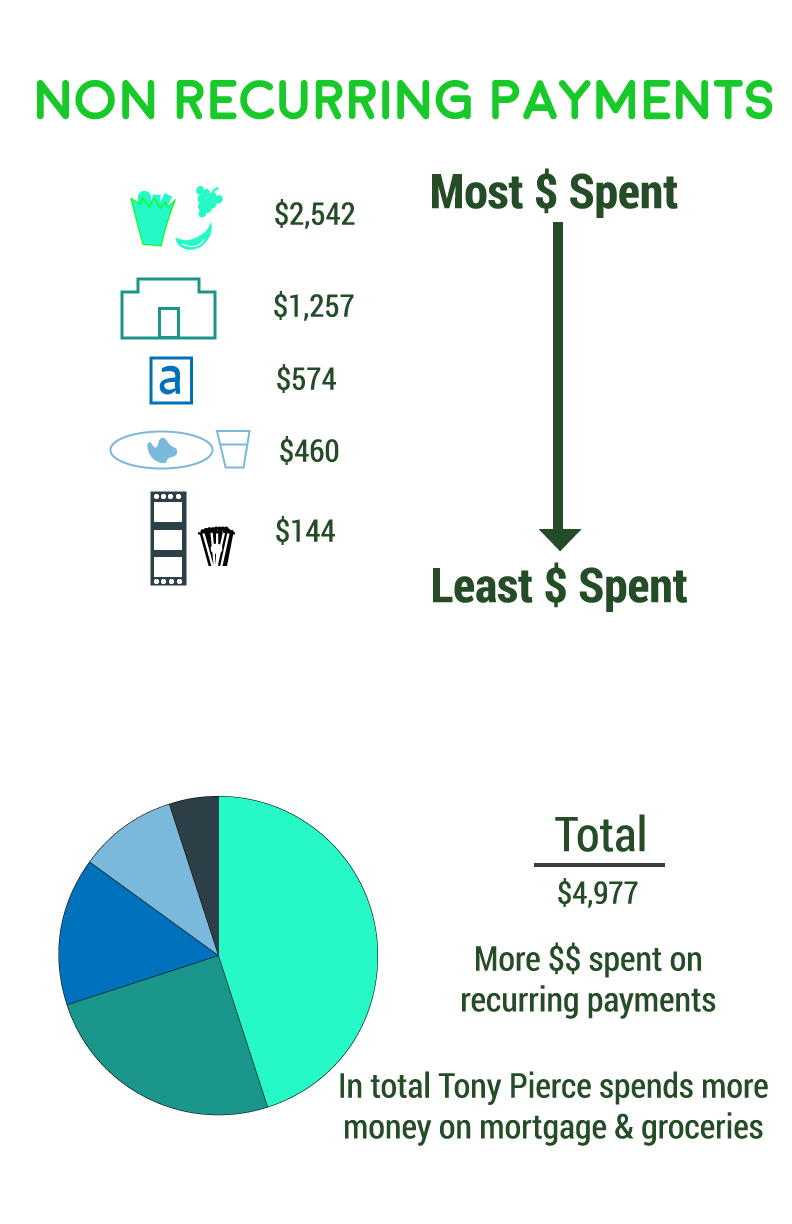
For our second map we had to analyze Tuan’s receipts on things he had spent money on, and find a way to organize that information. I did so by separating the recurring payments vs the non recurring payments, since there were a fairly good amount of recurring payments on his receipts. Recurring payments included things like mortgage, loan payments, phone bill, and utilities bills. Non recurring payments were things like going out to the movies, restaurants, and Amazon. I created different icons for each one of these and organized it based on the most to least spent. I also color coded them, so each icon has a color that is the same color on the graph to represent the amount of spending. Going back and editing this map I would change a couple of things like the color of the icons because they all seem to similar, I wanted to keep the same range like green and blue just have different shades but they all kind of blend together as one especially the greens.