Apr
2018
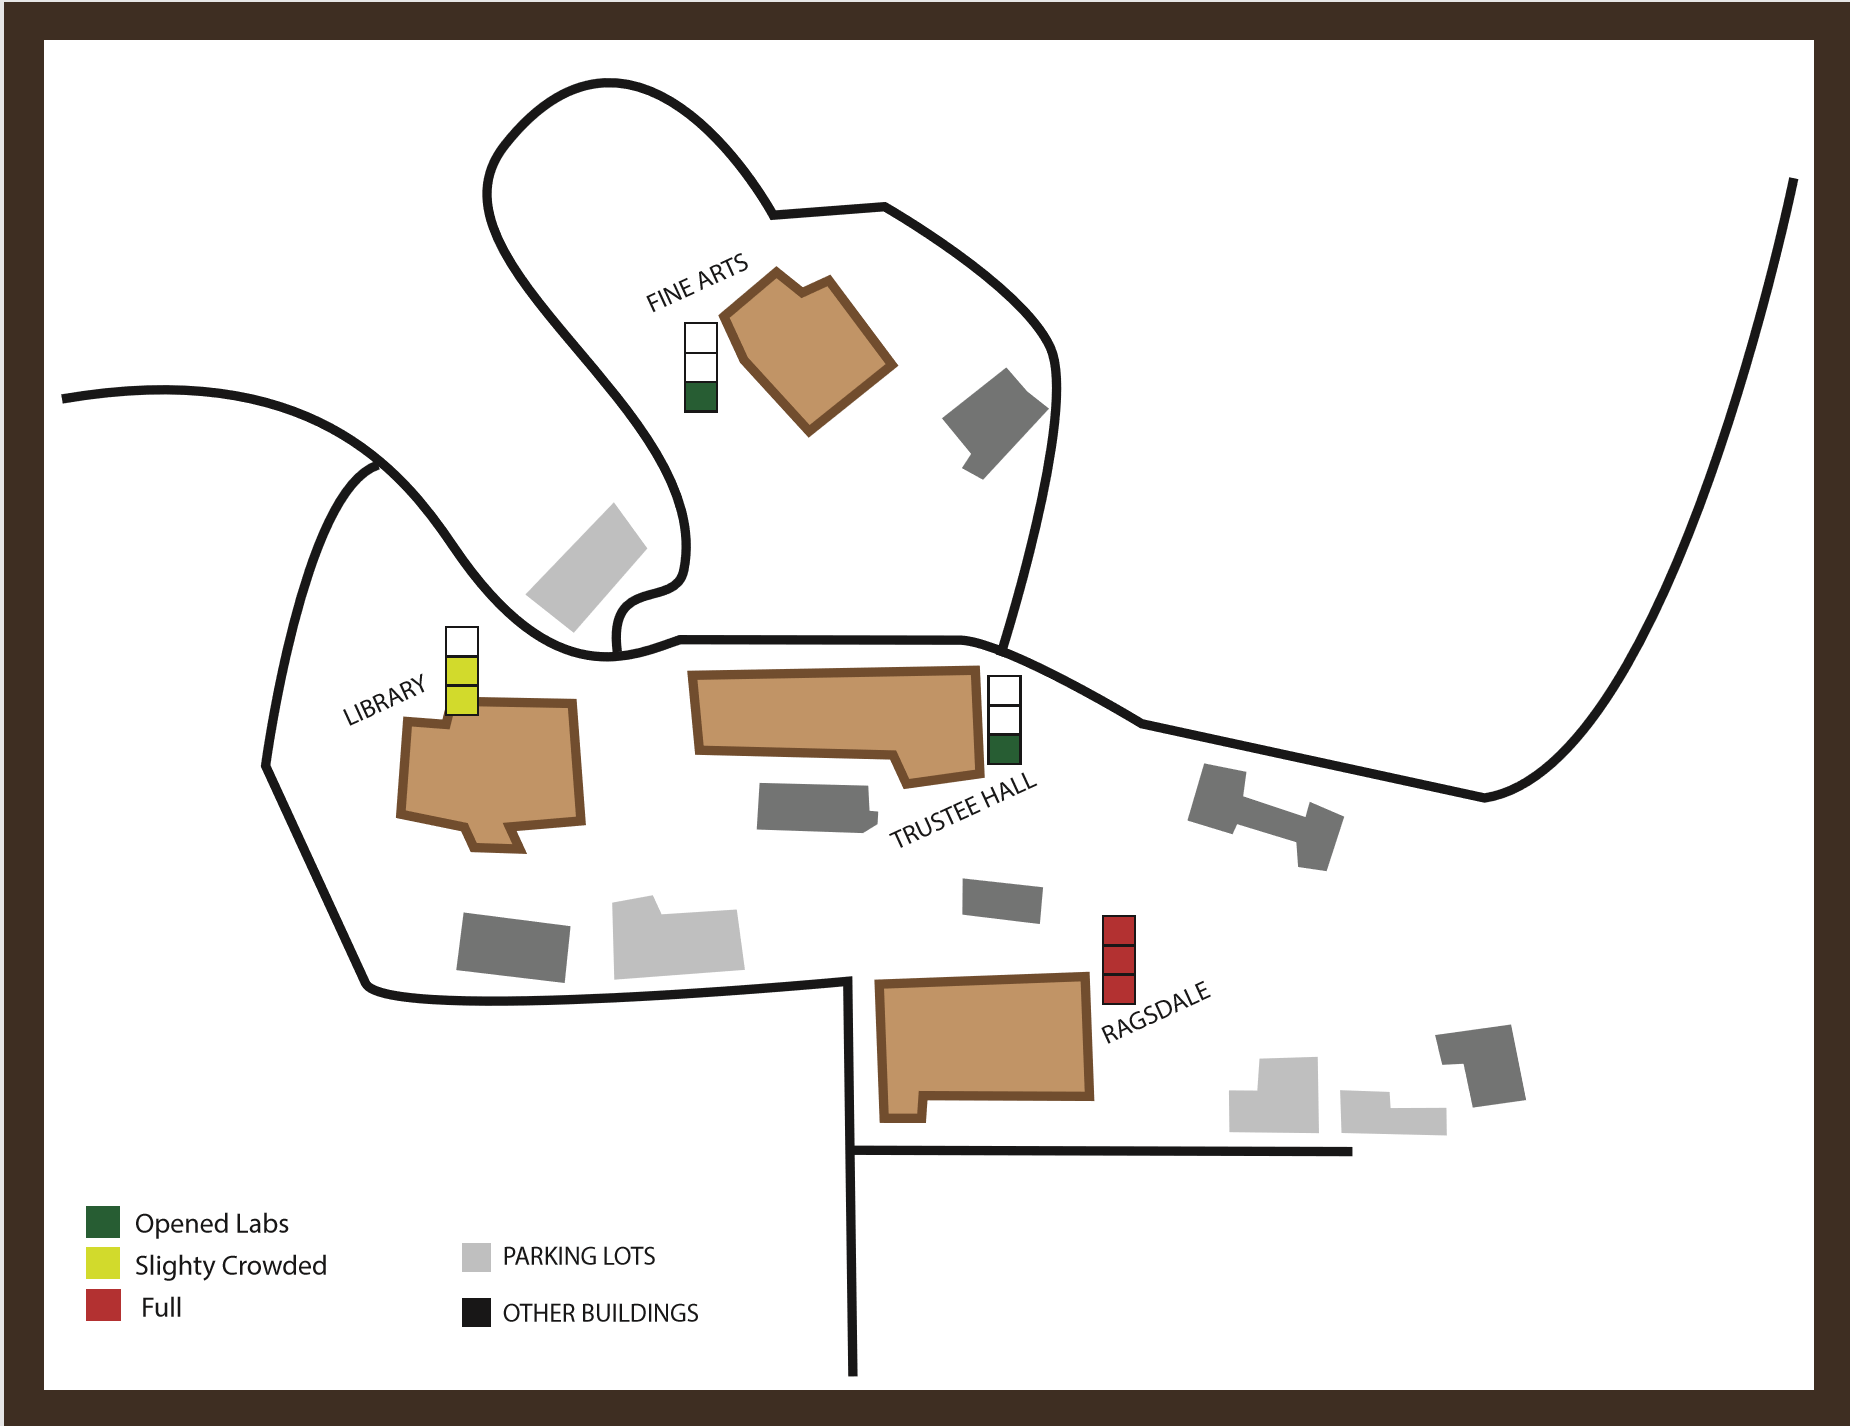
Mapping Project: Artifact Map
This map was designed to show how crowded the computer labs in St. Edward’s were on a specific day and time. I chose to map how full a lab was because I wanted to be in the know of what day time was easiest for a person to get access to a computer. I used the stop light colors to show when a computer lab had open spaces and when it didn’t. Green was a go, yellow was slightly crowded and red meant it was full. I design the map of the University because there are multiple labs around campus. I used color to emphasize the buildings that had a lab inside. I included the streets the surround the areas, so a person won’t get lost. What I should’ve added to the design is the name of the streets and the surrounding buildings to make it easier for another’s eye.