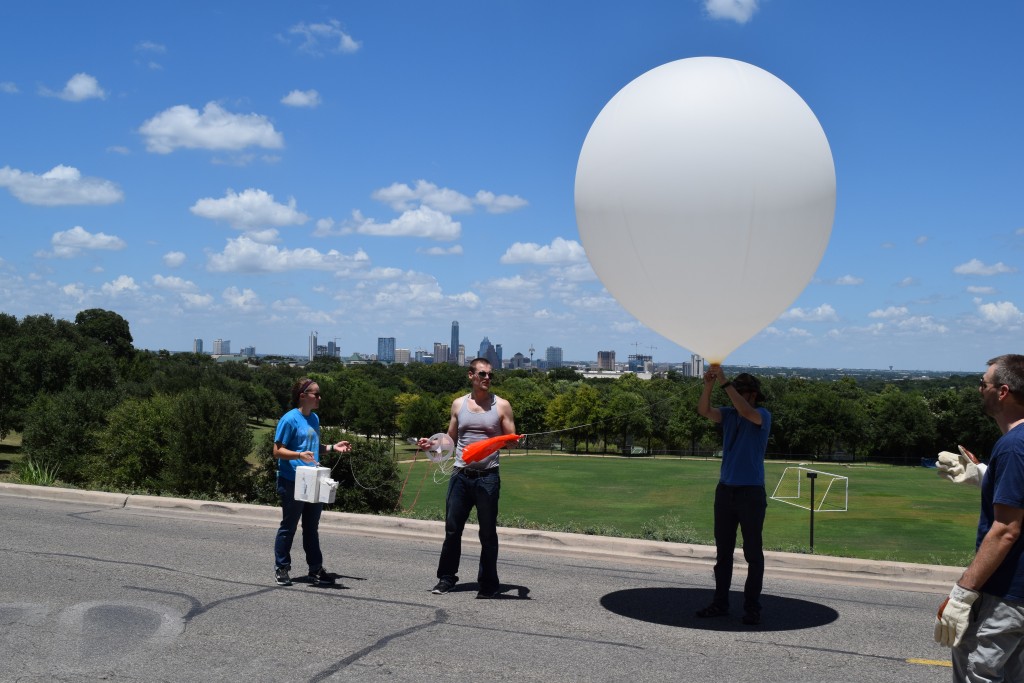
Preparing to release the balloon in front of Main Building with Austin in the background on Saturday, 30 July 2016 – the first flight from St. Edward’s University.
The Tropospheric Ozone Pollution Project (TOPP) has come to the Hilltop! The project, started by Dean of Natural Sciences Gary A. Morris in Houston in 2004, has since coordinated >750 flights from Beaumont, College Station, Ft. Worth, Galveston, and Nacodoches in Texas; Valparaiso and Ft. Wayne in Indiana; University Park, PA; Cumberland, MD; St. Louis, MO, and Hastings, MI, as well as Las Tablas, Panama; San Jose, Costa Rica, and Sapporo, Japan.
Now we add Austin, Texas to the list. With funding from the Capital Area Council of Governments (CAPCOG) and the Texas Commission on Environmental Quality (TCEQ), the St. Edward’s University team will fly 16 weather balloons to measure ozone along with meteorological data over the next two ozone seasons (2016 and 2017).
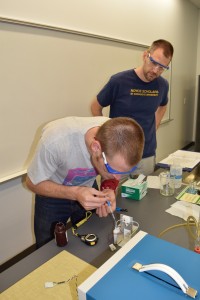
Ace Manning (SEU undergraduate) prepares an ozonesonde for flight while Physics Professor Paul Walter supervises.
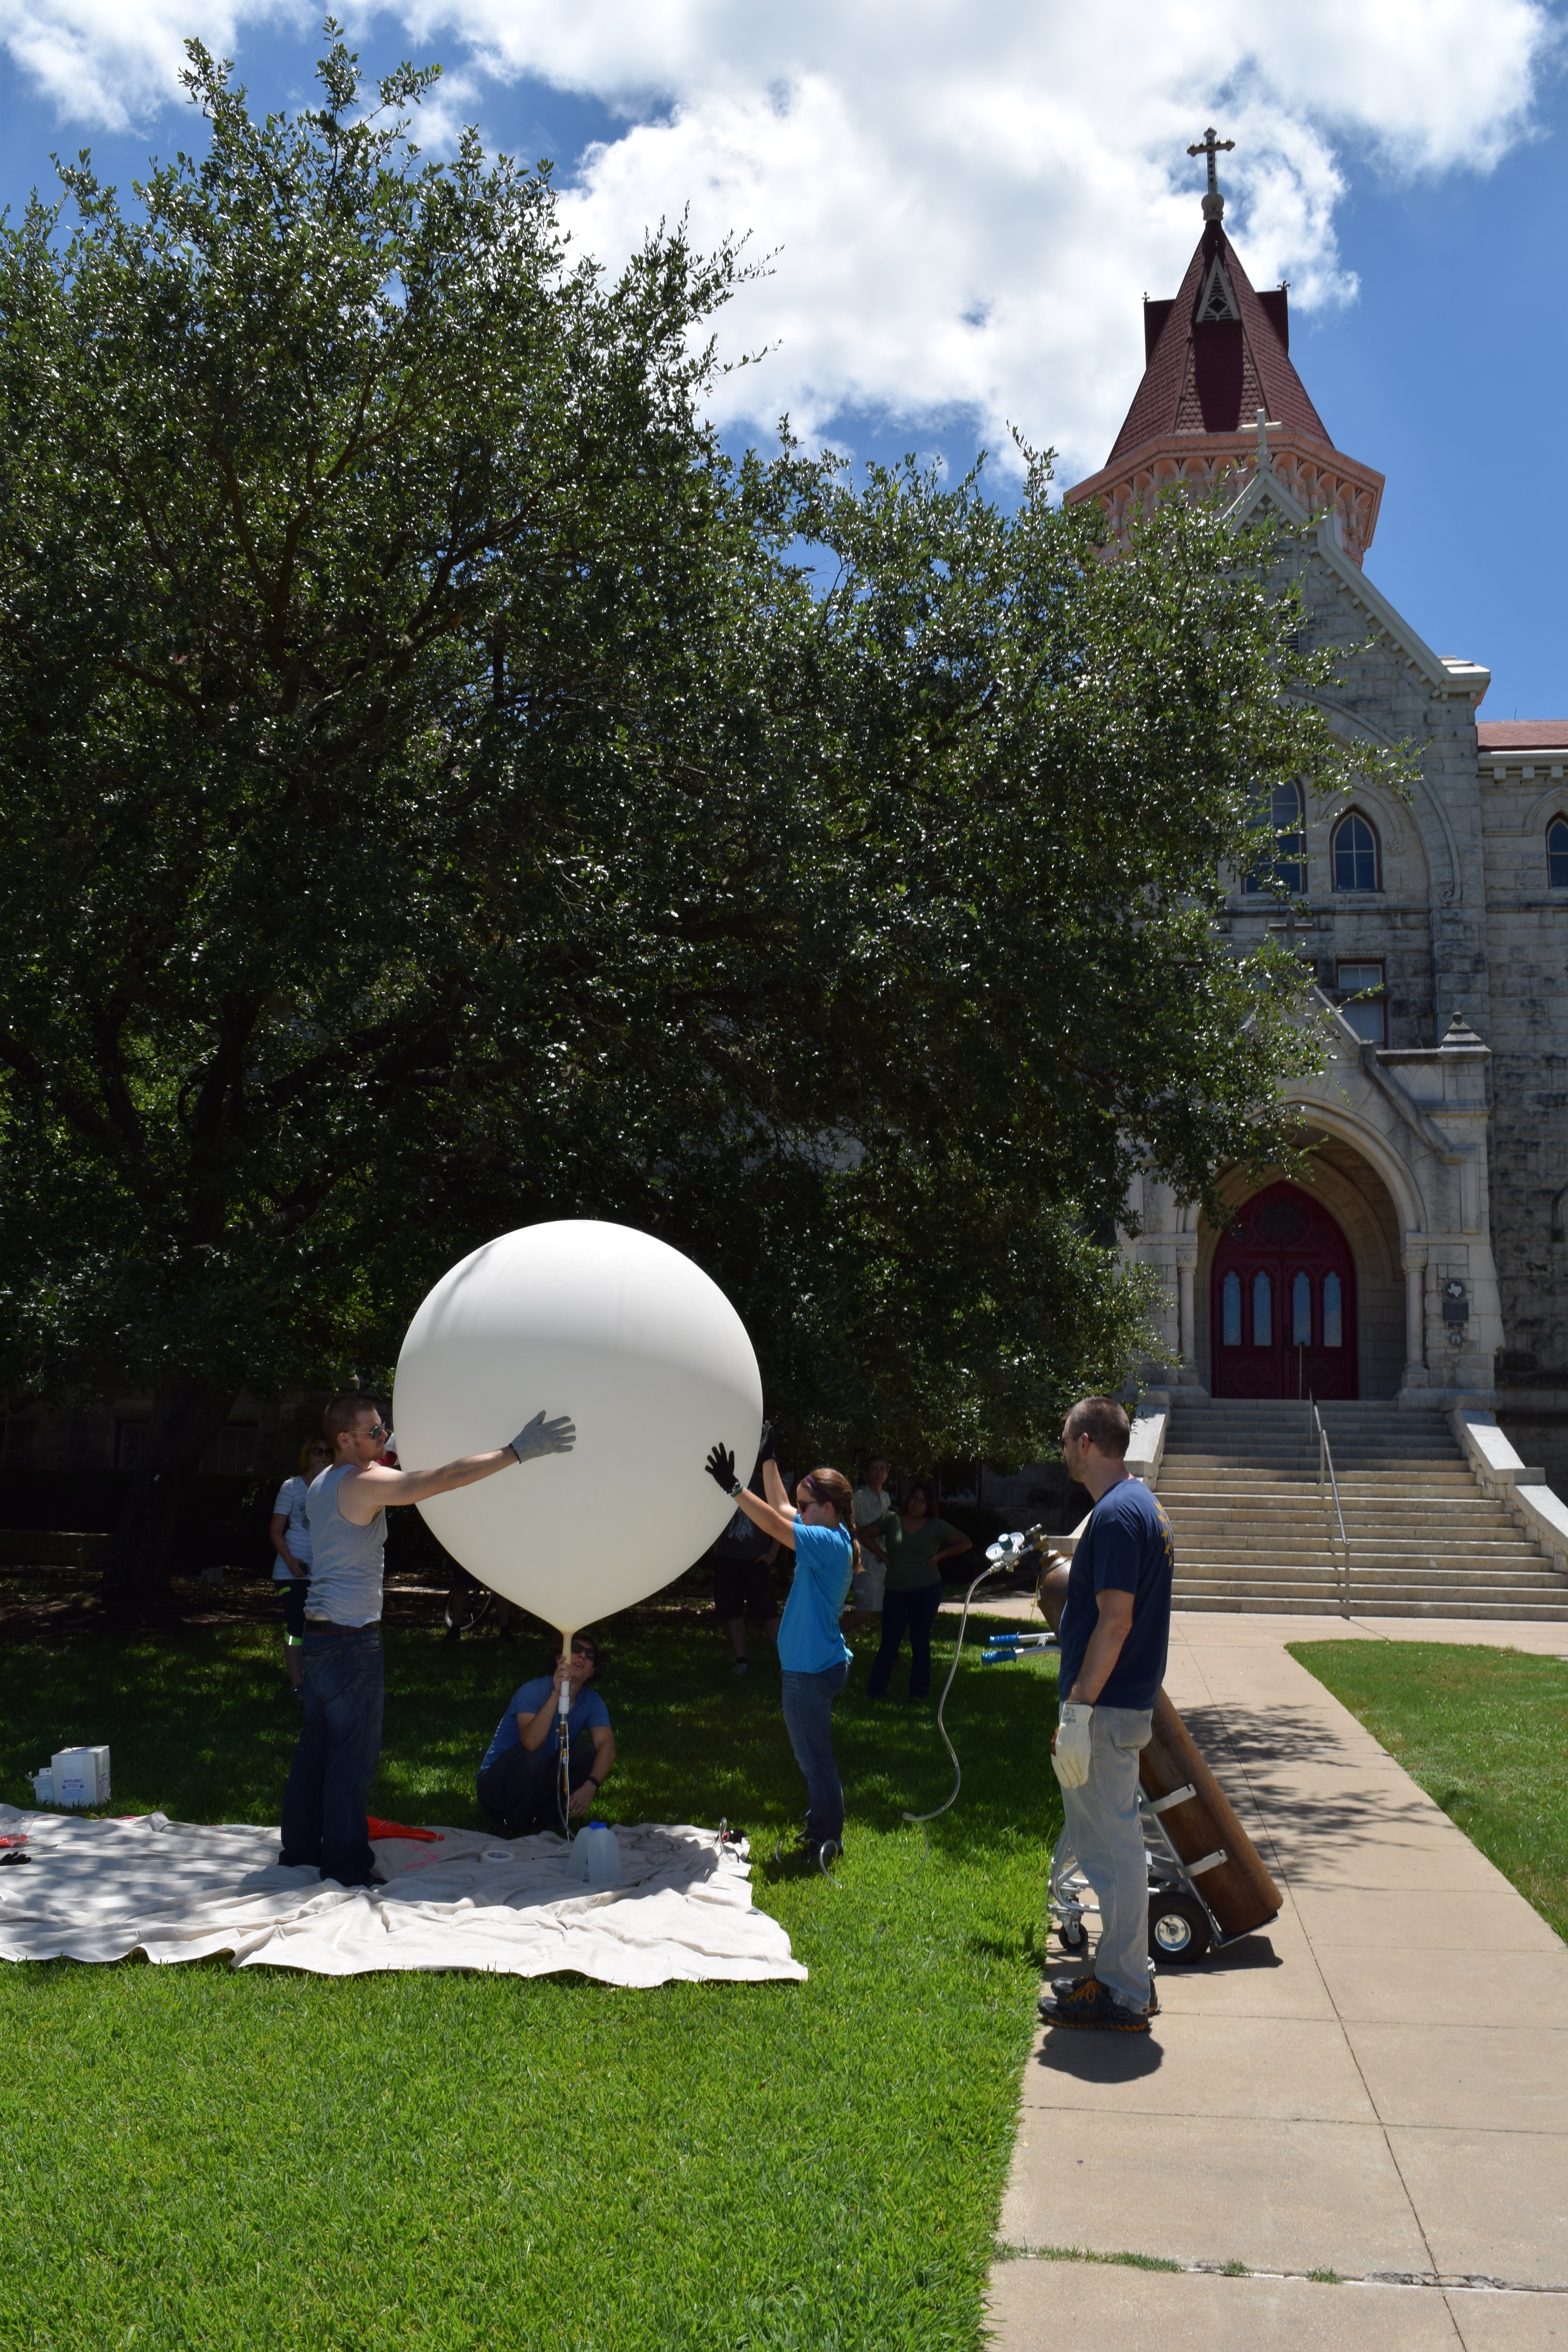
The project’s initial Austin flight occurred on Saturday, 30 July. The launch team prepped and calibrated the instrument in the John Brooks Williams South Building, then assembled in front of historic Main Building to fill and release the balloon around 2:15 pm CDT. The balloon ascended past 30 km at a rate of ~ 5 m/s before popping. Members of the launch team were able to see the balloon (a small white dot) overhead for the entirety of the ascending portion of the flight.
The balloon came down near Spicewood, TX about 2 and a half hours later. The initial ozone profiles can be found on the project website.
The second weather balloon launch has been scheduled in conjunction with the Austin Area STEM Conference for Thursday, 4 August at around 1:30 pm CDT, weather permitting. Given the start of the construction project at Main Building, our next launch will occur on the North side of the Mary Moody Northen Theatre Building. All are welcome to come watch.
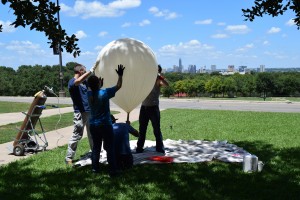
Filling the balloon with Austin in the background
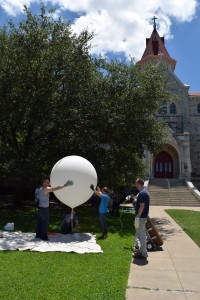
Filling the balloon with historic Main Building of St. Edward’s University in the background.
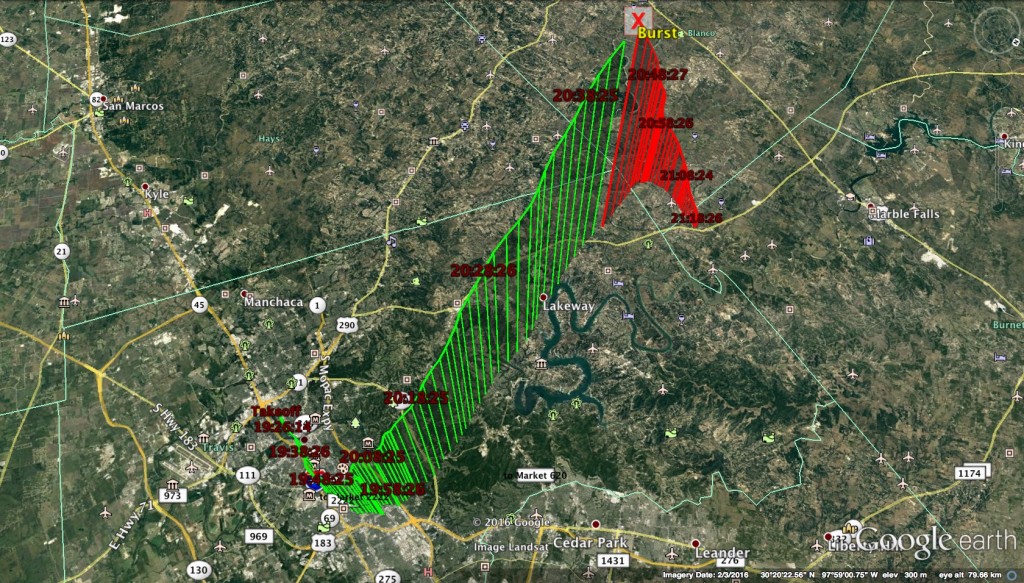
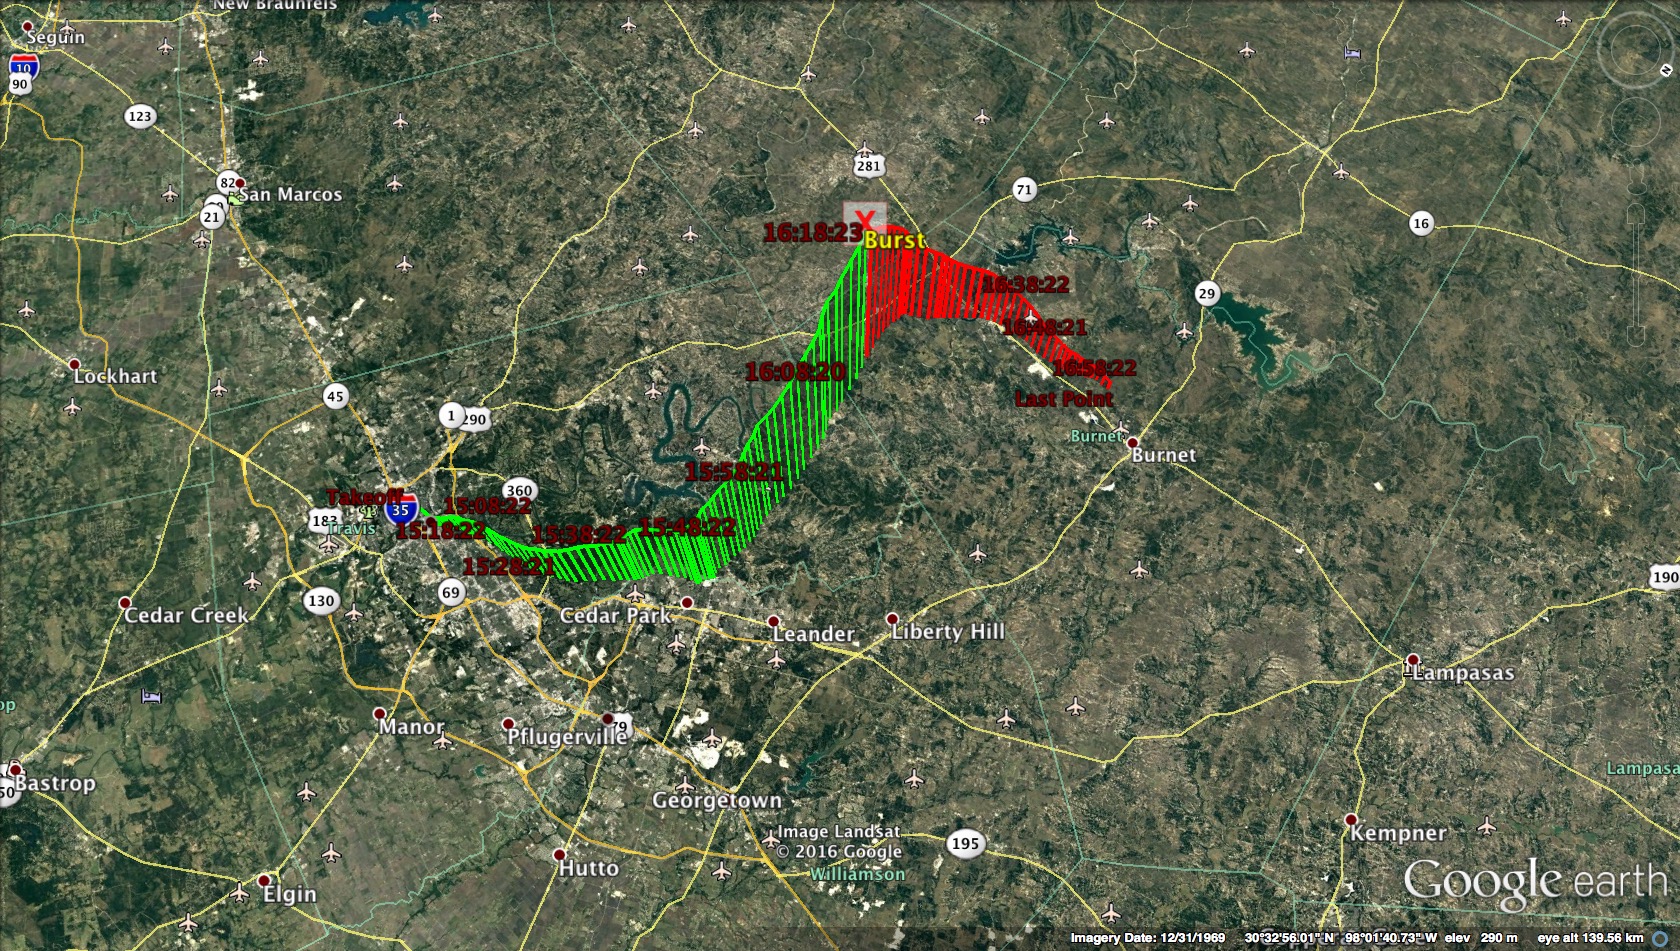
Flight trajectory based on GPS data for 30 July 2016 ozonesonde from St. Edward’s University. Map courtesy Google Earth.
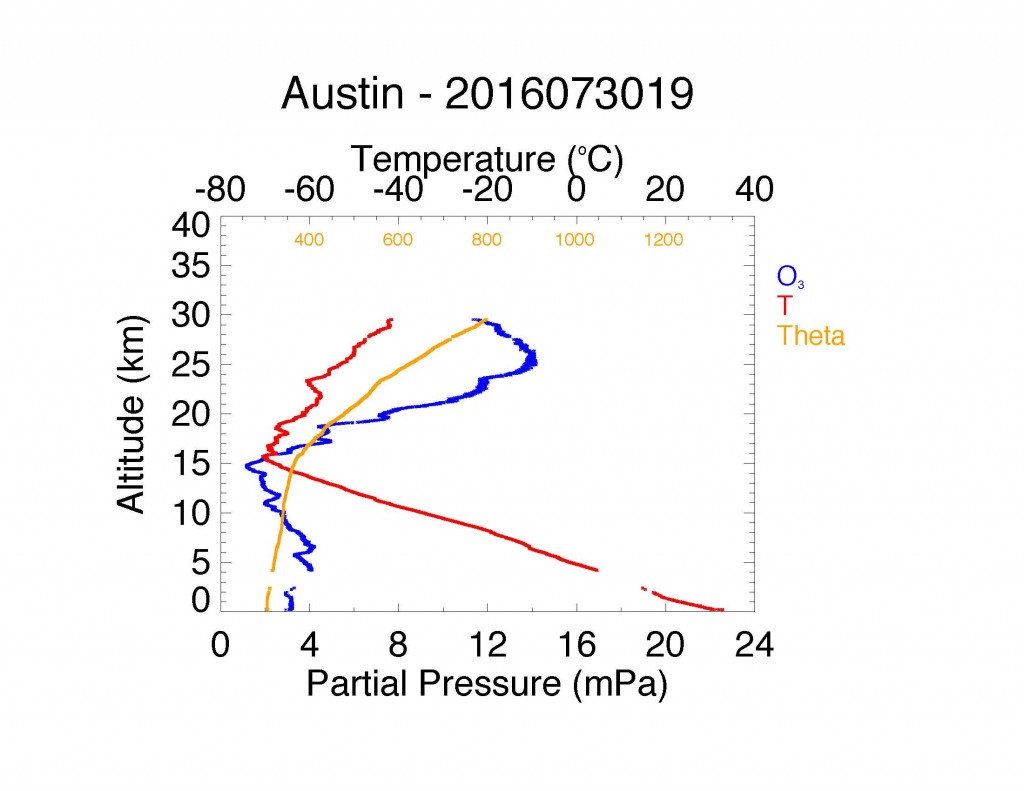
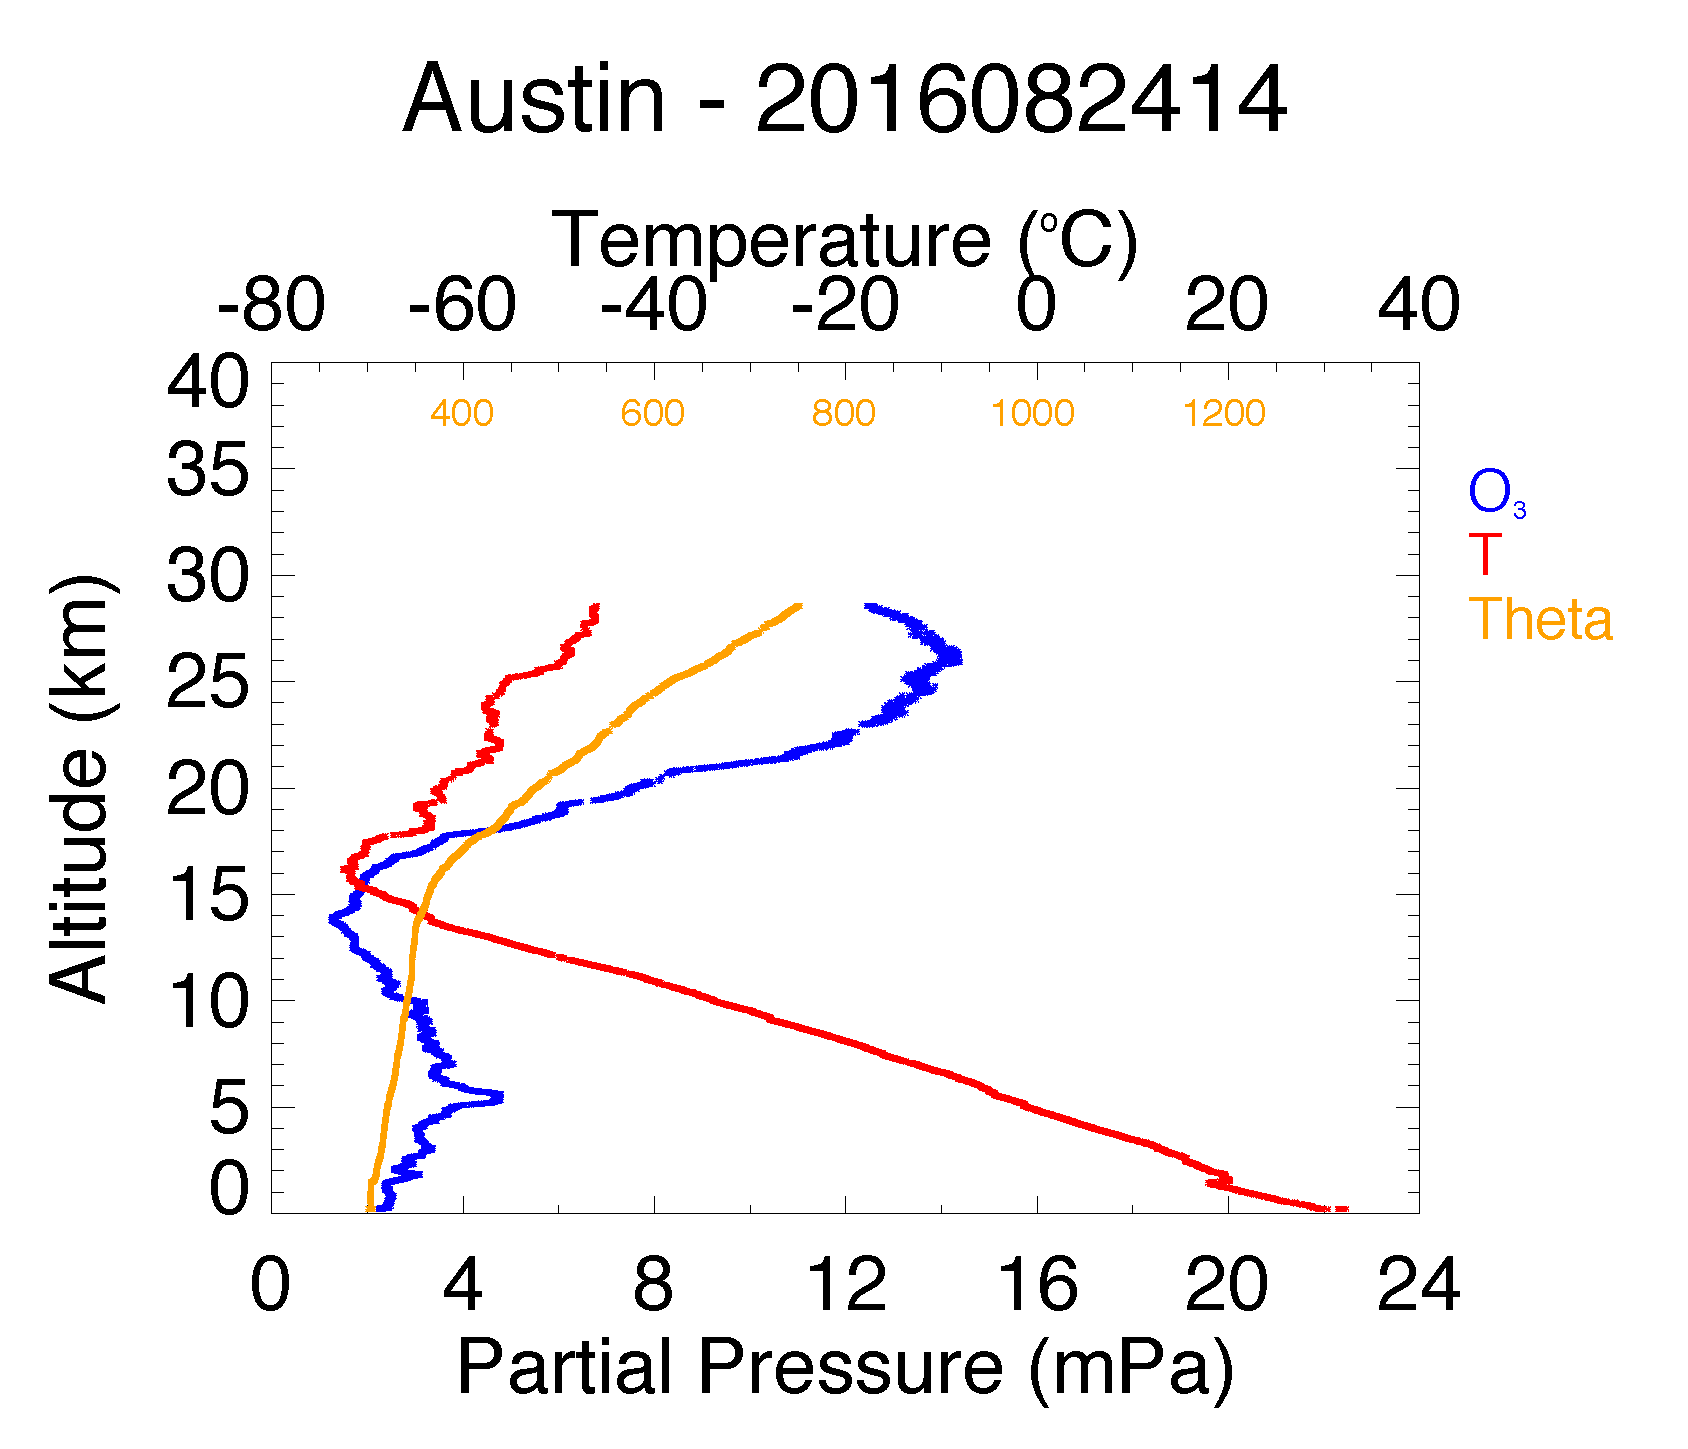
Initial ozone (blue), temperature (red), and potential temperature (orange) data over Austin, Texas from ozonesonde flight of 30 July 2016. The ozone layer is visible near 25 km (the peak of the blue curve), while the tropopause appears near 15 km (minimum of the red temperature curve).