FRAMEWORK
Previous research suggests that as climate becomes unstable and temperatures become more extreme in some places, the fitness and performance of many organisms will be diminished (Kearney, Shine, & Porter, 2009). Researchers predict animals will accommodate their behavior in order to buffer the impact of global warming (Kearney at al, 2009)An experiment conducted using terrestrial isopods founds that when exposed to highly variable thermal conditions, the isopods displayed more conservative displacement (Rojas, Castillo, Folgera, Abades, & Bozinovic, 2014).
UPDATE ON DATA COLLECTION

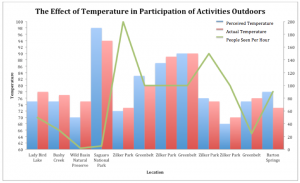
Fig. 1. The Effect of Temperature in Participation of Activities Outdoors: Perceived Temperature vs. Actual Temperature and their effect on People Seen Per Hour.
DISCLAIMER
The graph above serves as a summary of the data collected prior to this entry. However, it is by no means a good representation of human behavior, specifically the number of people who participate in activities outdoors, and how it is affected by changes in temperature. There are various limitations to the current display of the data that discourage its use for predicting or explaining human behavior. While future updates will include more data with more descriptive representations, this summary does raise some interesting questions.
DISCUSSION
Perceived temperature vs. Actual temperature
As defined in the previous entry, actual temperature is the temperature your smartphone says it is while perceived temperature refers to the temperature that you think it is according to what it feels like. What is interesting about the data collected so far on regards to perceived temperature vs. actual temperature is that 57% of the times the temperature was perceived to be less than the actual temperature. Temperature was only perceived as higher than the actual temperature 28% of the times (there are two entire data entries absent from the summary above due to missing data that would not have allowed for a concise graphical representation. A full summary is available at the end of this entry).
A temperature perception experiment conducted in the University of Minnesota Duluth explains that when a finger moves from cold to warm water, hyperpolarized warm receptors on the skin respond stronger than depolarized cold receptors, sending more signals to the brain (Temperature). In other words, when your finger is in cold water, cold receptors have to do all the work while warm receptors chill. But when your finger moves to hot water, all of the sudden the warm receptors that were chilling have to pick up the pace from zero to a hundred in a few milliseconds, sending more signals to the brain than cold receptor, which are quickly slowing down to let warm receptors take over. This results in a warmer perception of the actual temperature of water. The experiment concludes that thermoreceptors respond more strongly to a change in stimulus.
Drawing from the concluded in the experiment mentioned above, it makes sense that perceived temperatures would generally be cooler than actual temperatures after 1 hour outdoors due to desensitization of the receptors working at that given temperature. The opposite can be seen in two of the four cases in which temperature was perceived as warmer than it actually was. Both of these two cases involved water. The differences in temperature were of 3F at the Greenbelt and 5F at Barton Springs. According to the official website of the City of Austin, Barton Springs Pool maintains an average temperature of 68-70F (Barton). The actual temperature on the day data was collected at Barton Spring was 73F while the perceived temperature was 78F. This aligns with the conclusion of the UMD experiment, which showed that thermoreceptors respond more strongly to a change in stimulus. In this case, going from 70F to 73F made it feel like 78F. My mom always told me not to take warm showers as a way to stay warm in cold weather. I suppose she was right.
Exciting news
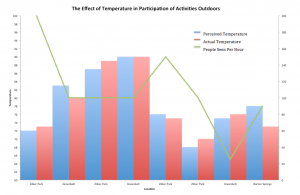
The following graph is a cut-out of the visual summary. While it continues to fail as an accurate predictive measure, it is more descriptive than the summary. What makes this graph a better representation is that the information is organized chronologically, and data was collected between the fifth and the twenty-eighth of March within the same general area.

Fig. 2. The Effect of Temperature in Participation of Activities Outdoors: Percieved Temperature vs. Actual Temperature and their effect on People Seen Per Hour in Zilker Park, Barton Spring, and the Greenbelt.
I am excited for the way this graphs depicts an interaction between temperature and human activity. In my previous blog, I generally predicted people to be more likely to participate in outdoor activities if temperatures were neither too cold nor too warm. This graphs supports my hypothesis by looking only at the entries from Zilker Park, which peak when temperatures are between 72F and 76F but drop when temperature go above or bellow that range. Zilker Park is worth isolation from the other two location mentioned in the graph because it lacks a body of water. What is also exciting about this cut-out of the summary is that it makes sense for there to be a higher tolerance for warmer weather in the presence of a water body, and for the number of people who engage in activities outdoors to drop lower at the Greenbelt than at Zilker Park when temperatures drop bellow the mid 70’s.
CONCLUSSION
Research suggests that extreme weather condition brought about by global warming will affect the ability of organism to conduct self-regulating functions like homeostasis (Rojas et al, 2014). Like terrestrial ispods, I expect human behavior to change in order to adjust to high daily thermal variability. One obvious change in human behavior is a stronger predisposition to stay indoors in order to avoid extreme or unexpected weather conditions.
LOOK FORWARD TO…
The next entry will discuss a new phenomenom called “Nature Deficit Desorder.” This is not an actual condition. Nature Deficit Disorder is a term created by the Author of Last Child in the Woods, Richard Louv, to conceptualize the detachment of today’s society from nature.
SUPPLEMENTAL MATERIALS
Full Summary of Data Collected

People Seen Per Hour was determined by dividing the number of people seen by the number of hours spent in nature.
BIBLIOGRAPHY
Barton Springs Pool. Retrieved from https://austintexas.gov/department/barton-springs-pool
Kearney MR, Shine R, Porter WP (2009) The potential for behavioral thermoregulation to buffer cold-blooded animals against climate change. Proc Natl Acad Sci USA 106: 3835–3840.
Rojas, J. M., Castillo, S. B., Folguera, G., Abades, S., & Bozinovic, F. (2014). Coping with Daily Thermal Variability Behavioral Performance of an Ectotherm Model in a Warming World. Plos ONE. 9(9). 1-9. Doi:10.1371/journal.pone.0106897
Temperature perception experiment. Retrieved from http://www.d.umn.edu/~jfitzake/Lectures/UndergradPharmacy/SensoryPhysiology/Somatosensation/TempPerceptionExp.html