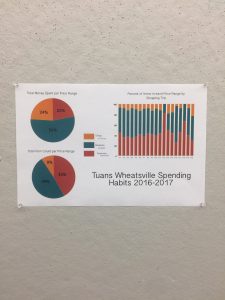
The purpose of turning raw data into a visual representation was to practice making choices that consistently matched the needs of the type of information. Symbol making, understanding infographics and legends were some components that went into creating the Information Map. Using Tuan’s spending habits that documented purchases going several years back, I decided to make a pie chart and a bar graph that displayed three categories of Price Range.


