
Six weeks ago, I began my journey working with one of the industry’s leading environmental and safety consulting firms for private sector clients. The idea for my project came early on in my training when trying to organize the different regulations from all of the different states we provide services to. With clients in over 42 states, learning all of the regulations for the industry was difficult to sort out.
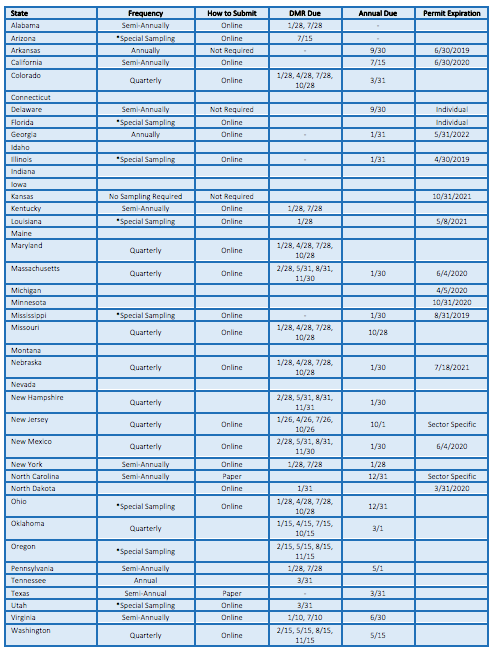
To better assist in training future employees and breaking it down for our clients to make the regulations easy to understand, I have begun creating an interactive map that provides all of the information or FAQs per state. Important information such as reporting dates and deadlines, regulatory nuances, sampling details, and common forms they may need are all embedded in the map.
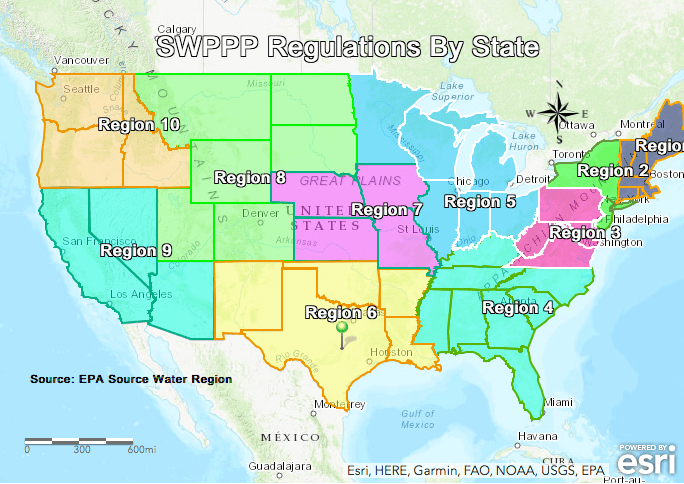
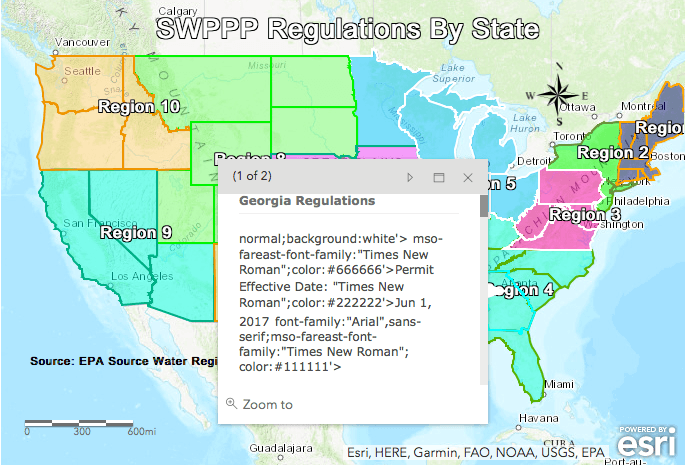
Using ArcMap and HTML software the preliminary map is colored by EPA region depending on their reporting agency. Each state can be clicked on individually and additional information can be found in the callout.

My research hasn’t all been easy, specifically the coding as I have had difficulty with the display of the information. At times the details show up exactly as I wanted them too and other times the codes pop up. This is all normal when creating a map like this.
I will continue to workout the details and clean up the colors for better presentation and ease of understanding. I hope this map, when finished, will be a vital tool for new employees and clients.