Weather Report
The weather report project helped to relate type to motion, and to do this studied the L.A.T.C.H. system for making effective animations. I decided to choose a capital city in a country close to each corner of a map where the Atlantic Ocean is in the center, and used the weather conditions in those cities over my birthday weekend for the animation. I used latch, time, and category structures to convey the weather information in different layouts, while keeping everything on screen. I was able to use previous knowledge with After Effects as well as new methods I learned in class to create a smooth animation with clean transitions between L.A.T.C.H. structures. The most difficult part of this assignment was figuring out how to animate the transitions in a way that wasn’t too crowded on the screen, but I am pleased with the final results.
Visual Identity: Mark
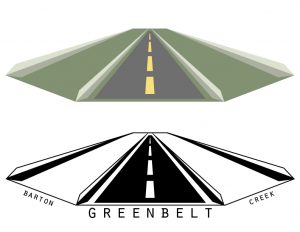
The mark project required me to make a logo for the public space that I had researched, and be able to represent a preexisting or new idea about the space through the mark. The final mark that I ended up with for this project is a reflection of my impression of the Greenbelt through the lens of both able-bodied individuals and those who have trouble traversing such difficult terrain as what the Greenbelt offered in many places. I sought to create a mark that could signal a change in this challenge. This mark represents a (hypothetically) improved Barton Creek Greenbelt with accessible trail options for people who don’t want to, or physically cannot, tackle more natural terrain. It puts inaccessible and accessible trail options on equal, shared ground and becomes an invitation for everyone to visit the Greenbelt. When integrated as a system, the objects within the mark (in this instance, the trail) can be replaced with other objects to represent other landmarks of the Greenbelt trail, such as side paths that lead to the water, or trails that lead one back out to the main road/entrance.
- Creek Access
- Main Road/Access Point
- Smooth Terrain
Process Work/Research
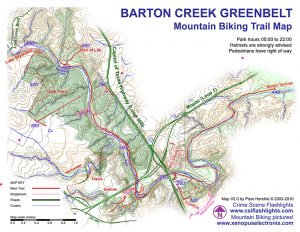
For this assignment, I chose to study the Barton Creek Greenbelt in Austin. One of the five methods for collecting research on a public space in Austin was to collect existing maps of the space, and then create a unique map of my own to represent a new idea, or update a previous one. When I visited the Greenbelt, I went with my family. I thought it would be a great way to spend the day in fantastic weather while getting homework done at the same time. It quickly struck me that although I, and other able-bodied individuals, enjoyed what the Greenbelt had to offer, my sister, who is wheelchair-bound, could not. I chose to make a map that highlighted which parts of the trail that I covered would be accessible and which parts wouldn’t be. I divided the Greenbelt’s terrain into three categories for feasibility of access: easy, difficult, and nearly impossible. Then I proceeded to assign these categories to the main trails that I walked over throughout my several visits to the trail, and added in other landmarks to the map for readability. 
- Official Map
- Minimalist Map
- Access Points
- Mountain Biking Trails
Expert Hours Goal Sp2017 – Loren
For this class specifically, I hope to have at least an hour and a half, or more, outside of class each day for projects in this class, for an average of 10-14 expert hours gained per week.
By mid-term, I hope to have at least 100 expert hours gained. My goal is that as I learn more in class, I spend more time practicing each new thing I learn outside of class, thus increasing my expert hours per week. By the end of the semester, I would like to have reached at least 175 expert hours, or better yet even closer (or over) 200.
As of now, considering all of the years that I have spent learning and practicing various graphic design techniques, I probably have nearly 4500 expert hours (going off of my estimations from last semester’s blog post).


