Zika is a virus that is transmitted by a mosquito species Aedes. People infected with Zika have symptoms such as fever, rash, joint pain, conjunctivitis, muscle pain and joint pain. Symptoms lasts from several days up to two weeks. First reported Zika virus transmitted to humans was in late 1940’s in Uganda Africa. Zika virus came into the world spot light during the outbreak in Brazil right before the 2016 summer Olympics. What concerns most people is how Zika was linked to Microcephaly. Microcephaly is a birth defect where the baby’s head and brain is abnormally small. Pregnant woman infected with the Zika virus can transmit the virus to the fetus causing the baby to born with Microcephaly.
This map uses raster to indicated how the Zika spread from Africa in the 1940’s all the way to Oceania where over 30,000 cases were reported in 2013. It was believed that the Zika virus spread to Brazil by the members of the French Polynesia Olympic team. The Points indicate areas that had an outbreak while the polygons indicate countries with Zika virus presence.
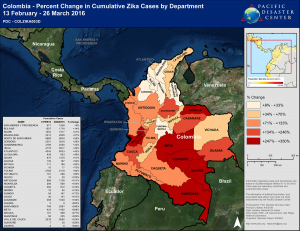
During the Zika virus outbreak in 2016, the Pacific Disaster Center collected the weekly epidemiology on the Zika Virus in Columbia to create a map that will help those making decision understand the extend of the outbreak of the Zika Virus. Using polygons and lines to map out Columbia and its departments. Each department is colored depending on the percent change of new cases if Zika virus infection. The base data was collected on 13th February 2016 with a weekly updated up until 26 March.
The final analysis indicates that there in an increase of Zika virus in every department in Columbia. Most of the Columbia’s departments has increased over 100% in less than two months which can be very concerning. By contextualizing the data using special analysis, decision makers can visualize how quick the Zika virus can spread and multiply in a very short time.
Pacific Disaster Center Uses Esri to Monitor Disease. (2016). Columbia – Percent Change in Cumulative Zika cases by department, February 13 through March 26, 2016. Retrieved from ESRI: http://www.esri.com/esri-news/releases/16-2qtr/smart-maps-track-zika-outbreaks-globally
http://www.arcgis.com/apps/MapJournal/index.html?appid=9e9ca7c6957f4616a05a4331f99a0c22

