- I’m not sure how many hours I would consider excessive, since I believe that putting as many hours in as possible is better than doing a set amount per week. I guess a good amount would probably be about 3-4 hours a day, which would give me personally a pretty good amount of time per day to play around with different ideas, and try to come up with the best solution for my project. That way I can also come back to the project every day and look at what I’ve done the previous day with fresh eyes. Anything less than that would probably result in much less sophisticated work. Two hours day definitely doesn’t cut it, because that’s not enough time spent playing around with ideas. Unfortunately, most of my outside hours were spent on the more complex of my maps, the flowchart, and so I didn’t give myself enough hours to really make the bar graphs and the personal geography map really interesting in terms of design. So for that last week I was spending at least 3-4 hours a day on my flowchart, but not enough on my other two maps.
- In terms of sophisticated work, we talked about the simplicity of the information shown, how comprehensive it was in its visuals, meaning how quickly and efficiently could the data be displayed and understood by the viewer. We talked about color a lot, and how it helped the comprehensiveness of the overall map, and of the visuals. Of all of my maps, my flowchart was the most successful, since it had the most comprehensive visuals, didn’t rely too heavily on words, and when printed out I thought the colors were really successful together and fit with the theme of seafood. My personal geography map was successful I think, in conveying its message, and all of the lines and visuals were pretty clear since I used one of the symbols for walking that everyone already knows, the footprints. I struggled a bit with the colors here and I definitely could have spent more time on that, and it wasn’t very rich in terms of information, so I think I also could have added a couple of interesting parts. My graphs were the least sophisticated in my opinion; the colors turned out alright, and the graphics were sufficient, but I wasn’t able to spend enough time on them to really get them above basic default design.
- I got the most feedback on my flowchart map, and so that’s probably one of the reasons why it turned out to be the most successful map. I mostly got a lot of feedback on the complexity of my choices, and whether or not I was making them into more than just yes or no decisions. That ended up with me using a rubric within my flowchart which definitely wasn’t something that I thought I was going to use in the beginning. I also got a couple of cautionary comments on the heaviness of the background color, which led to me adding a couple of color accents at the top to take away some of the weight and add a little more movement to the overall map. I also had some comments on my original graphs, since the way I had presented the bar graph was confusing, so I ended up getting rid of it in favor of a different bar graph.
- I found the most challenge in the flowchart graph, and it was the one I cared about the most, so I spent the most time there really trying to work out plausible solutions. When I was able to find the most effective ones (in my opinion), that’s when I was enjoying myself the most. A close second as far as challenge goes would have to be analyzing all of the information from Tony Pierce’s excel sheets; there was just so much information that it was hard to sort out what I wanted to do and what I didn’t, and once I had that information it was hard to visualize it in an interesting way.
- I did end up going to the East Austin studio tours and seeing Hollis and Alex’s work on display, but as far as workshops go, I wasn’t really able to attend, either because I’ve been busy working on stuff for other classes, or because the workshops are usually Saturday mornings, when I’m working. I will be submitting some of my copper plate engravings that I’ve been working on for printmaking to the student juried exhibition, since I spent so darn long on those.
- My life outside of school has definitely negatively impacted my schoolwork; because I have to work every weekend at home, and because it’s so hard to get days off from my manager, I have a really limited amount of time during the week where I can go into the labs that have Adobe on the server and really work on my design files, and that time became even more limited because I also had to work on my printmaking editions, which I also can only do on campus, and that takes much more time to do. And because I work at Starbucks, and because I have to get up early every weekend after weekdays with little sleep, I have even less time on weekends because I can’t function without napping at least an hour. So overall, just a lot more stress. (I should probably quit.)
- When I think of my ideal classroom environment, I think a lot of the environment that I had in printmaking this semester, where all of the work that everyone was doing was hands on, and so everyone would look in on each other’s work just because it was easy to see what other people were working on, and commentary felt really open. Everyone was learning from one another, which I feel represents the ideal class the most. When everyone’s working separately on computers though, it feels very isolated, and unless one person is actively asking others for their contributions, a lot of the students just stay behind the screen, and there’s not a lot of collaboration. I will include myself as one of the hiders, but I did collaborate a bit with other people outside of class time.
GDES 1
GDES 1 Map Project

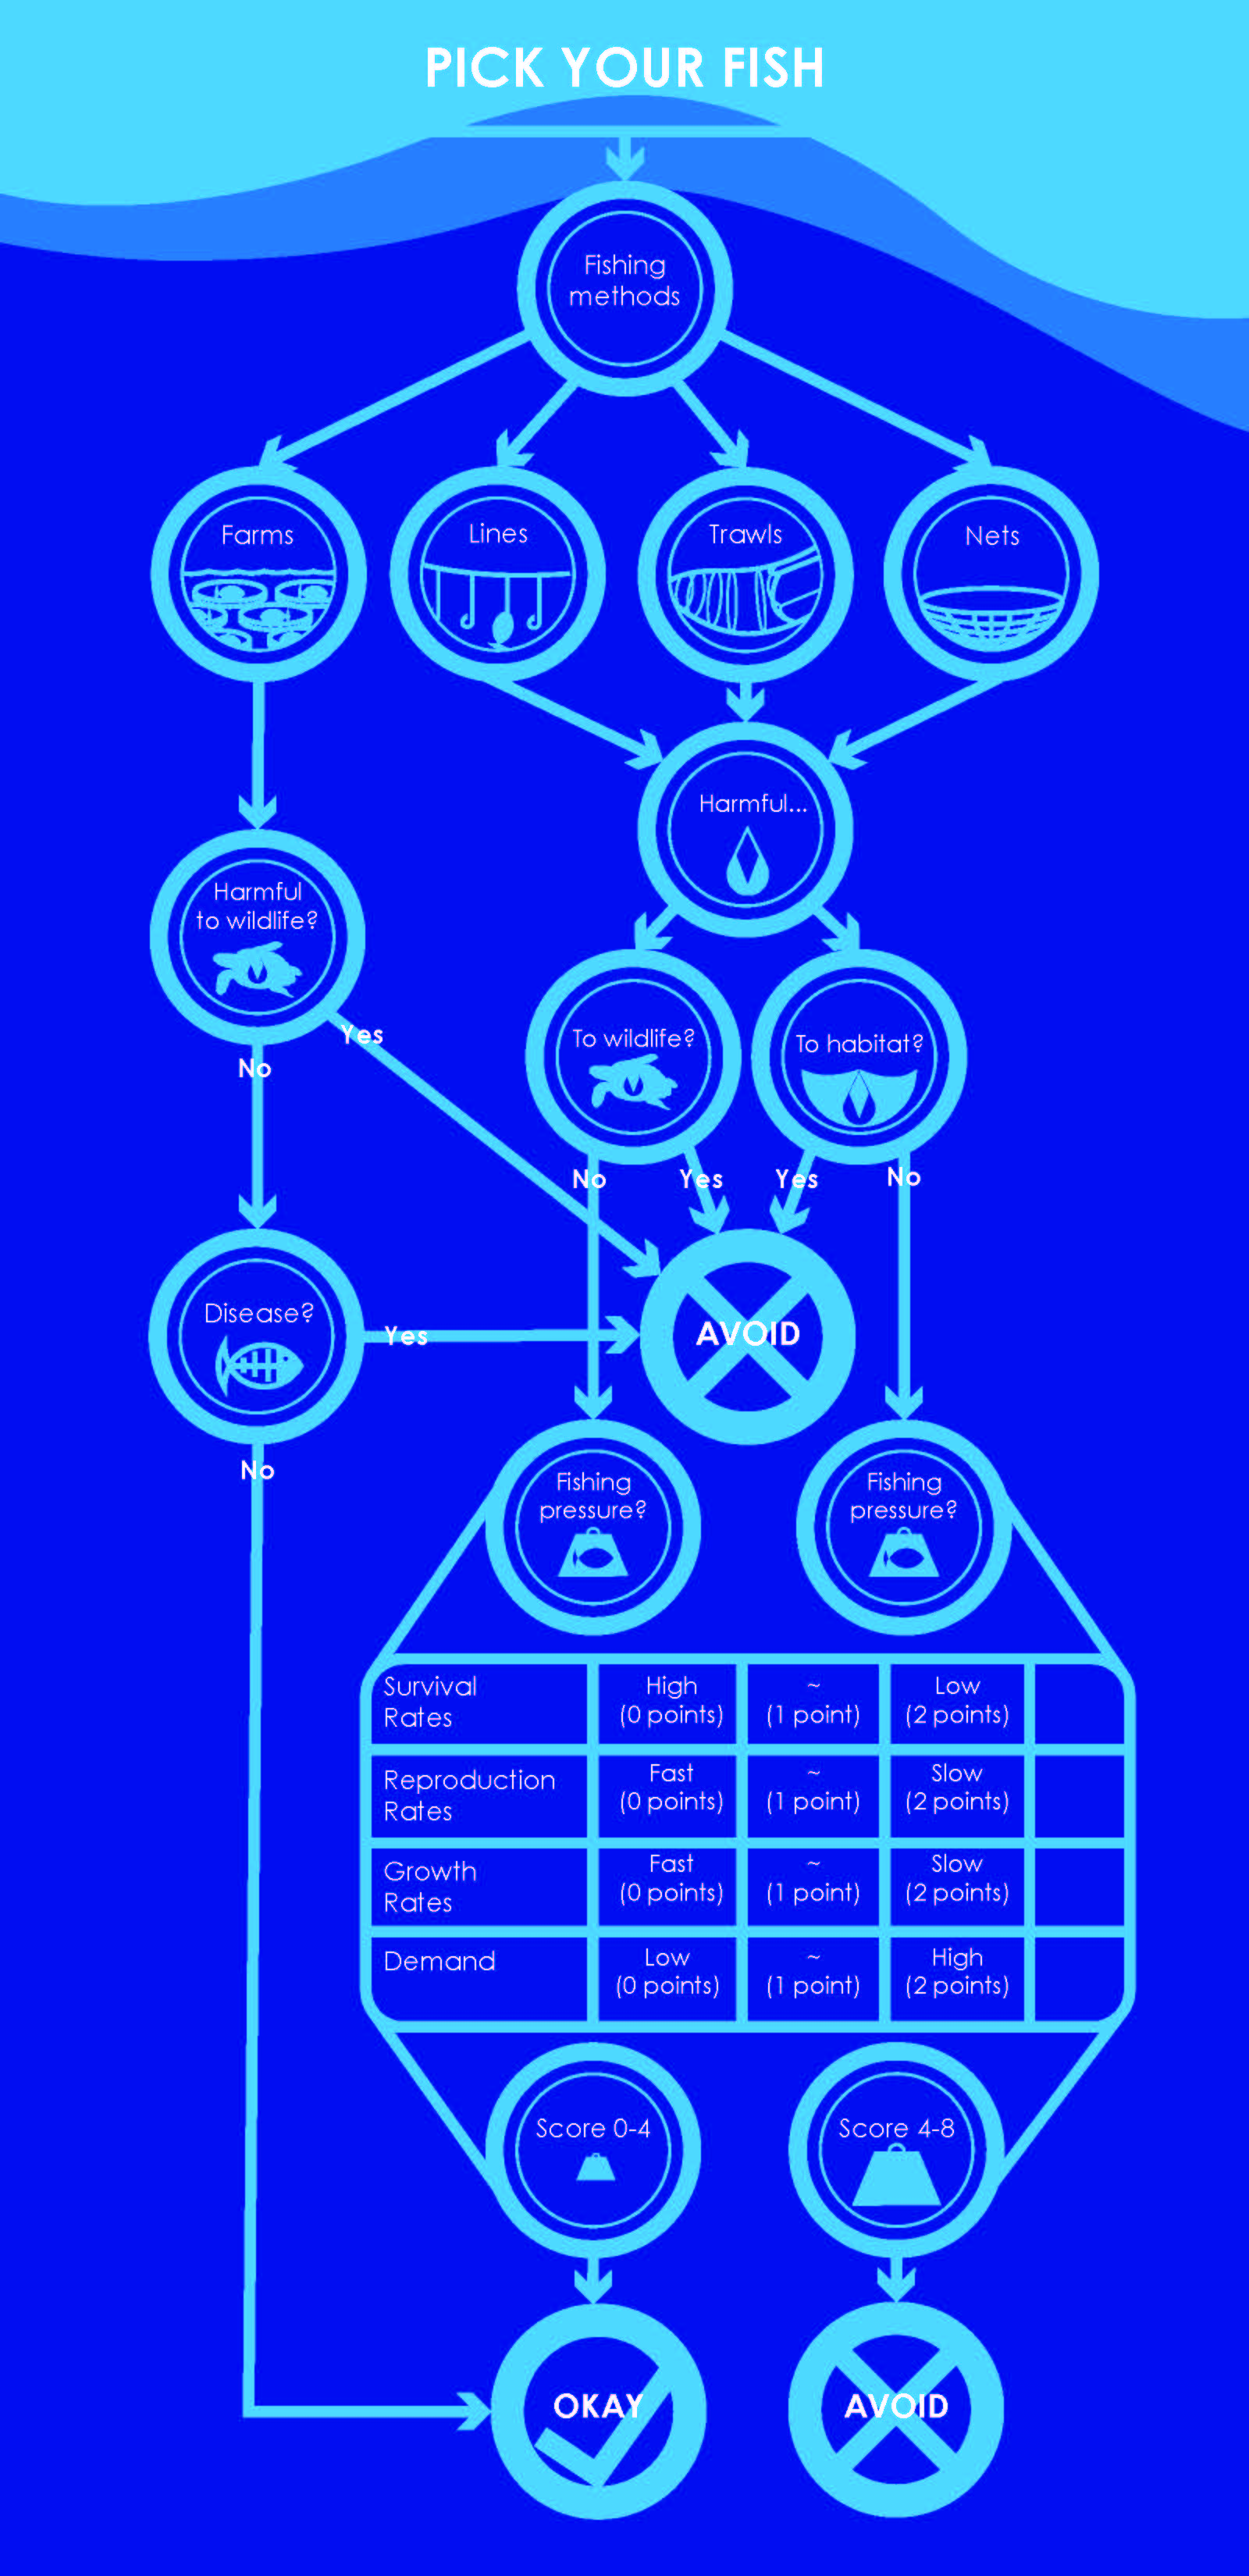
Mapping Project: Cognitive Map (decisions decisions)
This was a flowchart project! It’s a fairly simple idea: make a decision map that guides the viewer through a series of choices that answer one question, and end with multiple solutions. We specifically had to graphically display the various choices, the information that went into making those decisions, and then graphically represent the results. Unfortunately I don’t think I incorporated enough graphics to guide the viewer through the decisions solely on symbols. I chose a topic that involves a lot of information that usually could only be conveyed through text, although through the making of it I really tried to narrow the choices down to a couple of words and a symbol for each choice. I also drew a lot of the choices from prior knowledge that not a lot of people know, so I had to be really aware of that when deciding what to include. I used round decision points because of the many directions that each point could take. These round points then led to the underwater theme that makes up my whole flowchart, and really accentuates the theme: seafood.
Mapping Project: Information Map (visualizing information)
Visually displaying a small set of information from a big database was the challenge of this project; I was given an excel spreadsheet of all of the financial records of an anonymous “Tony Pierce” over the course of a year. I then had to isolate specific bits of information from the spreadsheet and map it to come to a new conclusion about this data that couldn’t be found in the spreadsheet. I chose to look through Tony’s records of all of the events and movies that he went to throughout the year, compare the number of events to movies watched, and the price difference between the two categories. By displaying this information, it’s easy to see that while Tony went to more movies throughout the year than events, he spent far more on the tickets to those events than on all of the movie tickets combined.
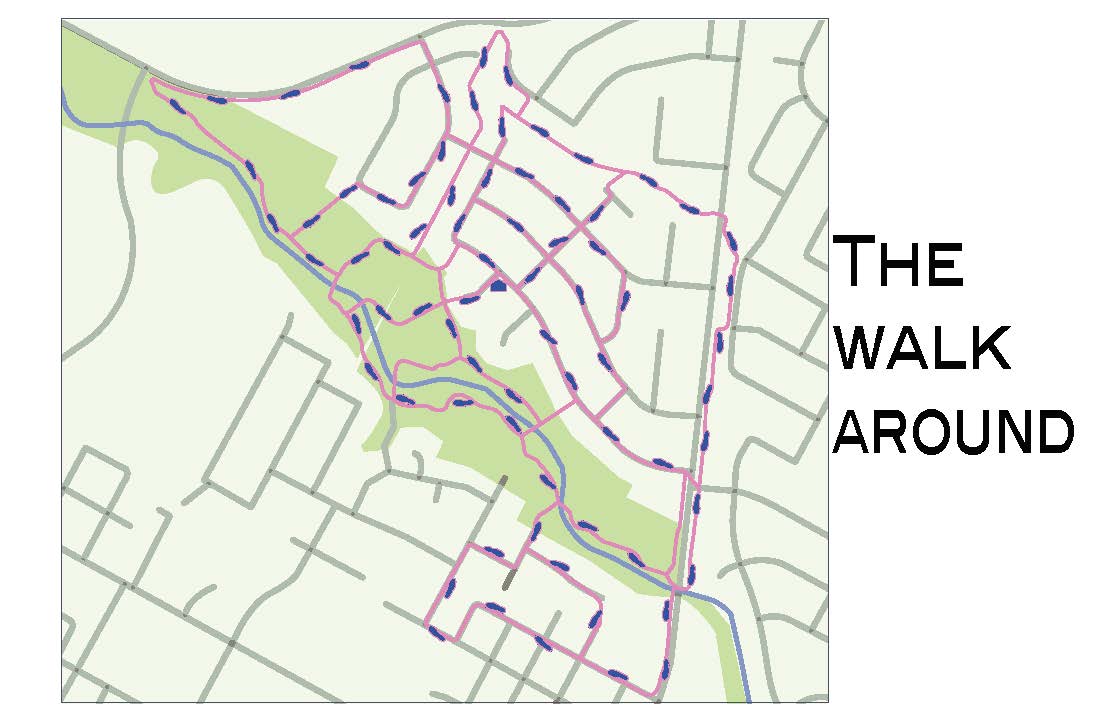
Mapping Project: Artifact Map (personal geography)
Personal geography was the first map in a series of three that we had to create, and this project focused first on some of the maps that I follow in my everyday life, and then pointing out the things that are special to me on those maps that one couldn’t see just from looking at streets in Google Maps. I decided to map out the walking paths that I take my dog on in the neighborhood I grew up in, which in itself is something that isn’t found on Google Maps. A lot of the paths that I take are dirt paths that only park-goers know about. This was what was special about this map for me, and while I could have added other points of interest, I decided to keep it the way it was.
Symbols Project Midterm Essay
- Seeing as the symbol project required 9 different base factors, I spent a lot of time at first just coming up with the photos and drawings that I needed to trace, not to mention the actual tracing part on the computer, where I had to put in a little extra time to make sure there were no kinks that could lead to problems later. After that, I spent a really long time coming up with combinations, especially with the idea of integration between symbols in mind. I think here is definitely where I spent the most time, and perhaps it wasn’t enough to truly integrate a lot of my ideas, but I definitely got more comfortable cutting apart my symbols during this time. Unfortunately I can’t boast constant work put into my symbols, as might be pointed out when I forgot to fill in my photo tracings, but I put a pretty significant amount of time into my integrated symbols and their iterations.
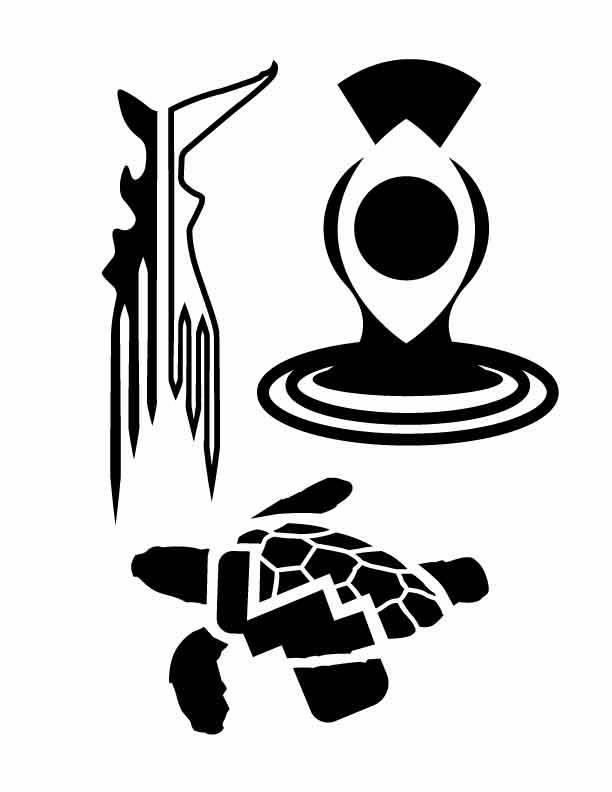
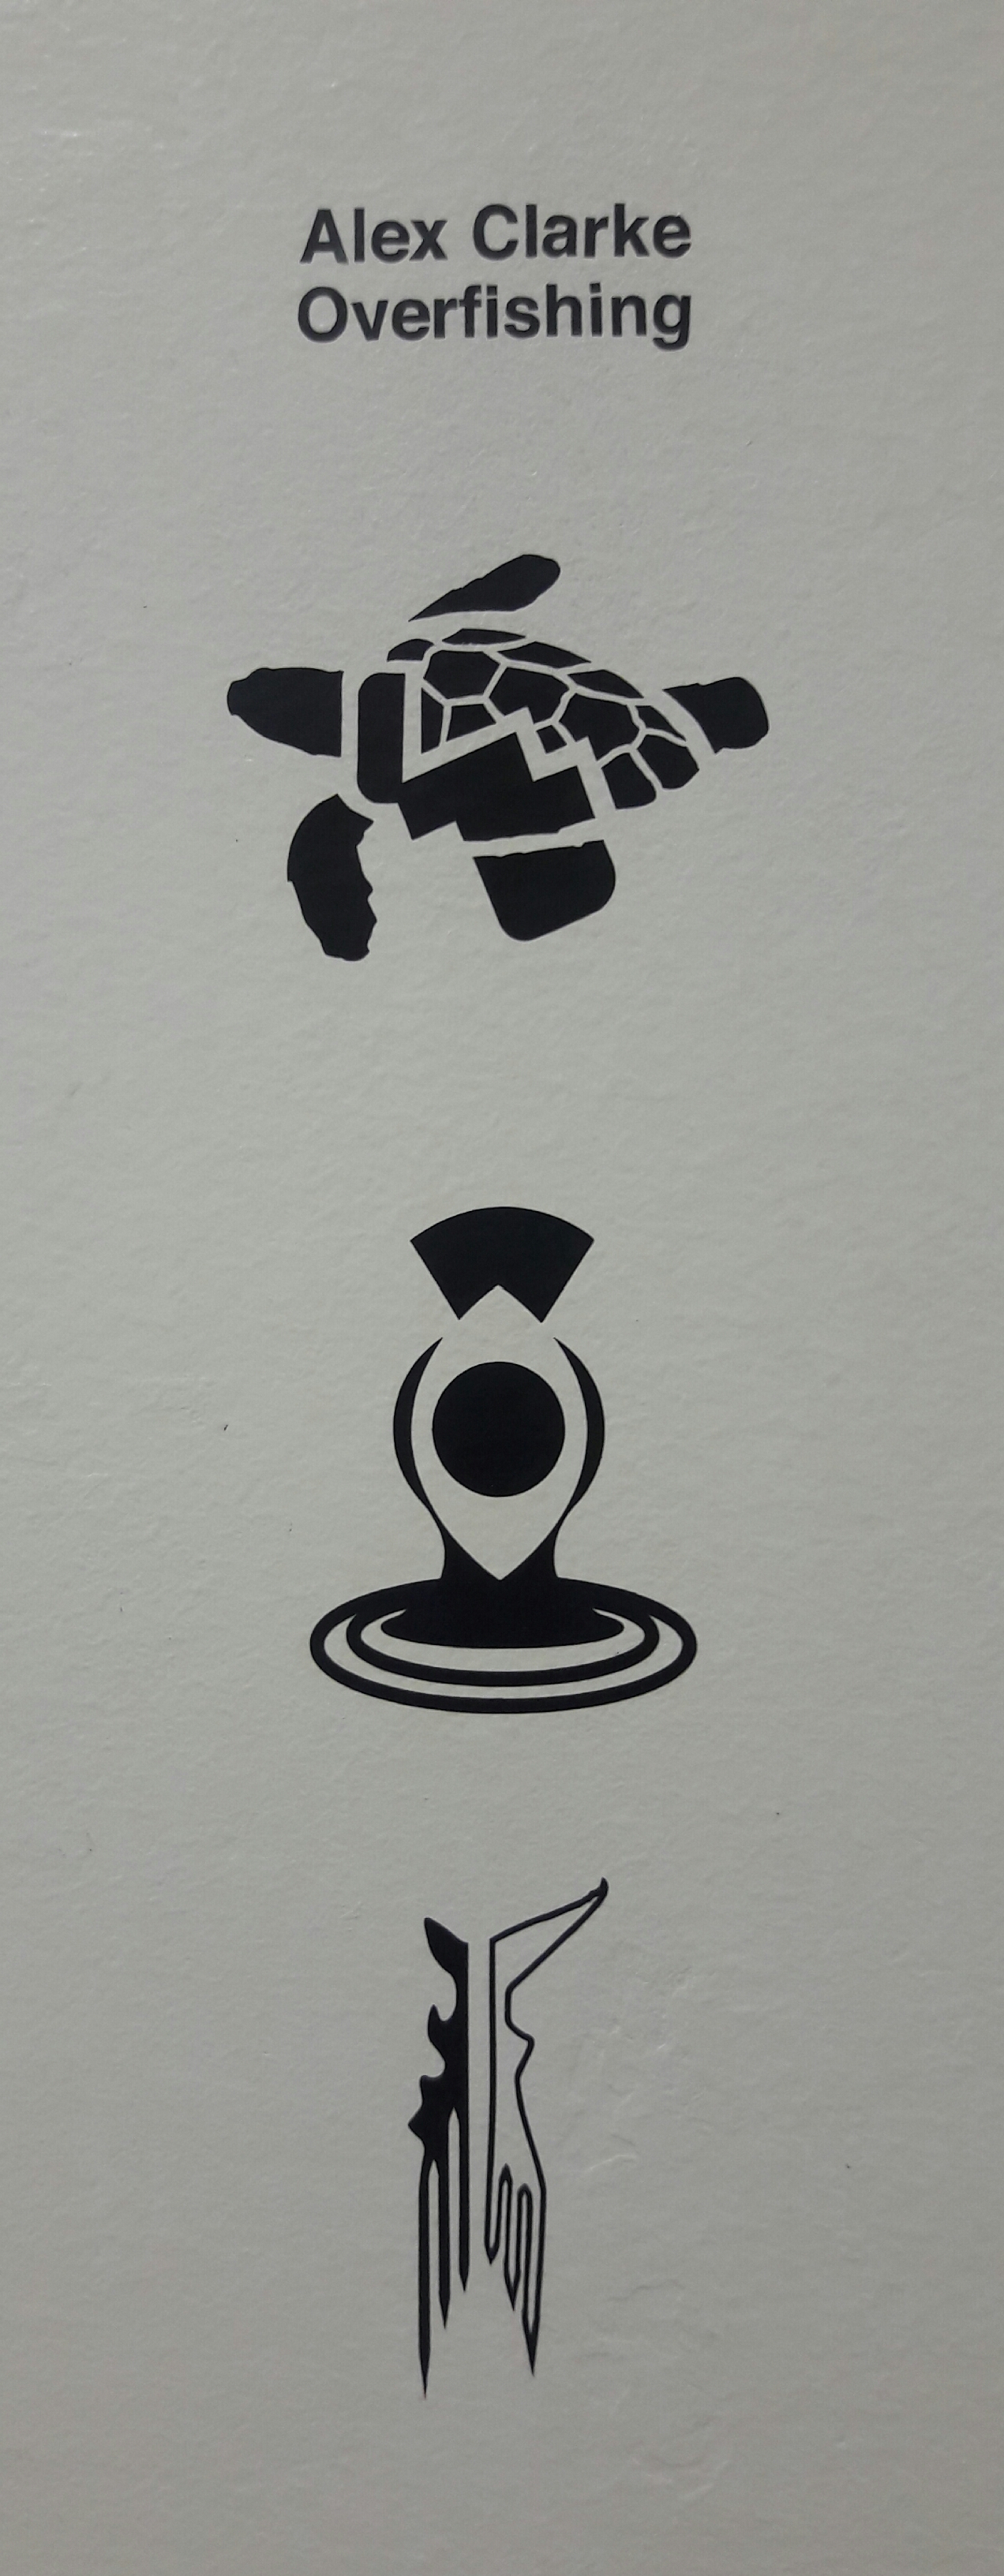
- Sophistication of my work came the easiest, especially since I’m usually pretty nit-picky, with my work more so than anyone else’s. I spent a lot of time smoothing out the connecting areas, especially in the shark’s tail and its varying degrees of thickness due to ‘unite’ defaults. The turtle’s shell also took a lot of time to get right, and I had to put in a lot of work just uniting and ungrouping, and then tweaking, and then uniting, and then inversing again and again to get the end result. In the end there was a lot of work making sure that all of my symbols fit into one cohesive whole, which was pretty difficult with my widespread/bycatch symbol, since it was made up of so much false negative space and separate ovals. All of the time really contributed to the solidity of my symbols, the balance, the simplicity, and the technical work that was the criteria for the project, and so I feel as if I got pretty sophisticated results.
- A lot of the feedback that I got from other students was pretty spot on: a lot of them suggested that I thicken or thin up lines, especially in my shark’s tail and in my turtle’s shell. I think the biggest contribution I got from everyone though was how much they really liked my combination of ‘widespread’ and ‘bycatch’ symbols (the alien head). If multiple people hadn’t pointed out how weird it looked and how much they liked it, I probably would have dismissed it. I’m really glad I took everyone’s advice though, because it really helped me focus on how I could make that symbol in particular a lot better.
- The biggest challenge I think I faced was trying to integrate two symbols into one seamless whole. My default reaction is definitely a lot more like the “default design” that anyone can do with a couple of clicks in Illustrator. So when it was pointed out to me that a lot of my symbols were just two things put next to each other, it was challenging to think of them in any other way. I’m not entirely sure how well I was able to resolve a lot of it, so while the challenge level was intense, I feel as if I wasn’t able to fully rise up to it, partly due to lack of continuous work, and partly because of lack of time.
- I’m not entirely sure what other expert experiences is supposed to mean, so I just interpreted it as the amount of playing around and experimenting within Illustrator to get different results with my symbols. I would probably classify my expert experiences as somewhere in the middle range, since I did a lot of playing around with pathfinder and ‘divide below’, as well as with shape-maker and the pen tool. So while I feel as if I have a pretty good grasp of those tools now, I admittedly might not have gone as far as I could have with a bunch of other tools, and so my other ‘expert experiences’ were limited.
- I would like to think that this project, in addition to all of the others that I’ve had throughout my freshman year, has contributed to a more mature social emotional development by forcing me to stop thinking of all of my work as precious. It also helped to remind myself that any comments made against the direction I wanted to go with a symbol was not a commentary against me as a person, and was only directed at my work as a suggestion. I think having a more mature outlook on critiques helped me to take more people’s advice and suggestions and apply them more efficiently to my work to help better it. I also just had to be more mature in order to fit in the time to work on this project, which took a lot of discipline to get it done along with all of the hours it took to work on my other big class, printmaking.
- I would like to argue that I contributed to a fairly warm classroom climate. Have I been a little grumpy at times during class? Yes. But I generally hate to just tear people down, so I really worked at consciously looking at people’s designs and ideas in ways to make them better, with the direction of their personal projects in mind. I think that I definitely responded best to the people who were really enthusiastic about their work though, and so it was really hard to help those people who clearly were just inventing up topics to get through the project. But overall, I think I gave fair feedback, and wasn’t a person that drags the whole climate down.
Symbol Methodology
This symbol project was one that I really enjoyed; I had to create a series of three different symbols around a certain theme, which for me was overfishing. The first step in the process involved tracing three different photographs of easily recognizable objects: a shark, a turtle, and a shrimp. The second step was coming up with drawing and tracing shapes for three different concepts, which for me were “illegal”, “bycatch”, and “fishing methods”. Finally, we had to abstract three other concepts and create random symbols from them, which ended up being “domino effect”, “endangered”, and “overfishing”. From those nine different symbols, I had a possibility of 81 different combinations, and ended up with the final three below. These three symbols contain some recognizable elements, but have a new meaning when combined together with other shapes.