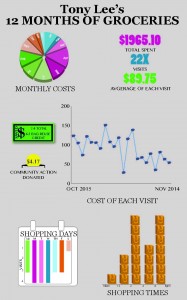
This map involved using visuals to provide data in a more interesting way. I focus on the individual designs of all the graphs from the pie chart that compared amounts to the dollar design that provided a total sum. I also spend time on the layout of the designs on the page and how they were being read from bottom to top as well as side to side.
